
 Price Smarts From Pattern Rejection, But Bulls Rem…")
Dogecoin (DOGE) hovered near $0.217 on May 21, slightly down from its local high of $0.26 reached on May 11. The memecoin has lost around 5% from its May 19 high near $0.236, but remains up more than 40% month-to-date. DOGE’s resilience stands out in a market where most large-cap tokens, including Bitcoin and Ethereum, have pulled back after last week’s brief surge.
Memecoins have shown mixed behavior this week. Shiba Inu (SHIB) gained nearly 25% in seven days, with strong volume pushing it through key resistance. In contrast, PEPE saw a 7% retracement from last week’s highs. The divergence reflects capital rotation across the memecoin spectrum, as traders recalibrate positions following the broader market’s consolidation phase.
DOGE remains one of the few tokens holding steady amid the volatility. Futures open interest has remained elevated, and spot volumes continue to support the range. On-chain data shows a recent whale outflow of over 170 million DOGE, triggering speculation about short-term distribution, but technicals remain constructive.
Meanwhile, social media sentiment around Dogecoin has turned bullish again. Mentions of a breakout above $0.24 have increased across Reddit and X, but the optimism appears rooted in expectations rather than confirmed catalysts.
Still, Dogecoin’s price action signals underlying strength as memecoins jockey for dominance in a fragmented rally.
Token Faces Crucial Breakout Test After Triangle Rejection
Dogecoin price continues to trade within a bullish ascending triangle pattern. The structure, defined by a flat horizontal resistance and a rising trendline support, reflects an accumulation phase that often precedes a breakout. In this setup, bulls repeatedly test overhead resistance while defending higher lows, indicating demand is building underneath the supply zone.
The pattern’s upper boundary near $0.242 has been a key resistance level since early May 2025. DOGE price attempted to break above it on May 10 but faced rejection, coinciding with the 0.618 Fibonacci retracement level from the local top.
That confluence likely intensified the selling pressure, pushing the price back inside the structure. As a result, the breakout attempt stalled, but the price has not invalidated the bullish structure. Meanwhile, a break above the immediate resistance could help DOGE price target the resistance near $0.266.
DOGE now finds dynamic support from its 200-day exponential moving average (green wave), which sits just above $0.216. The immediate horizontal support is near $0.2088, aligning with the 0.382 retracement. A deeper pullback would bring the ascending triangle’s trendline and the $0.19 zone into focus as the next major support.
The projected price target—marked on the chart—is derived using the standard method for ascending triangles: measuring the vertical distance between the base of the pattern and the resistance line, then extending that range upward from the breakout point. This method reflects the potential strength of the breakout, assuming momentum and volume confirm the move.
The structure remains unconfirmed until DOGE decisively breaks above the $0.242 resistance. But as long as price holds the pattern’s higher lows and critical moving averages, the bullish bias remains intact. A successful breakout would open the door to a larger upside move.
Traders Continue To Bet on Dogecoin Rally
Dogecoin price action in May triggered renewed optimism among retail traders and technical analysts. The token has been in the green even as broader memecoin sentiment remains mixed. DOGE fans have leaned into the bullish outlook, citing historical chart structures, improved on-chain support, and a new mining development as key drivers.
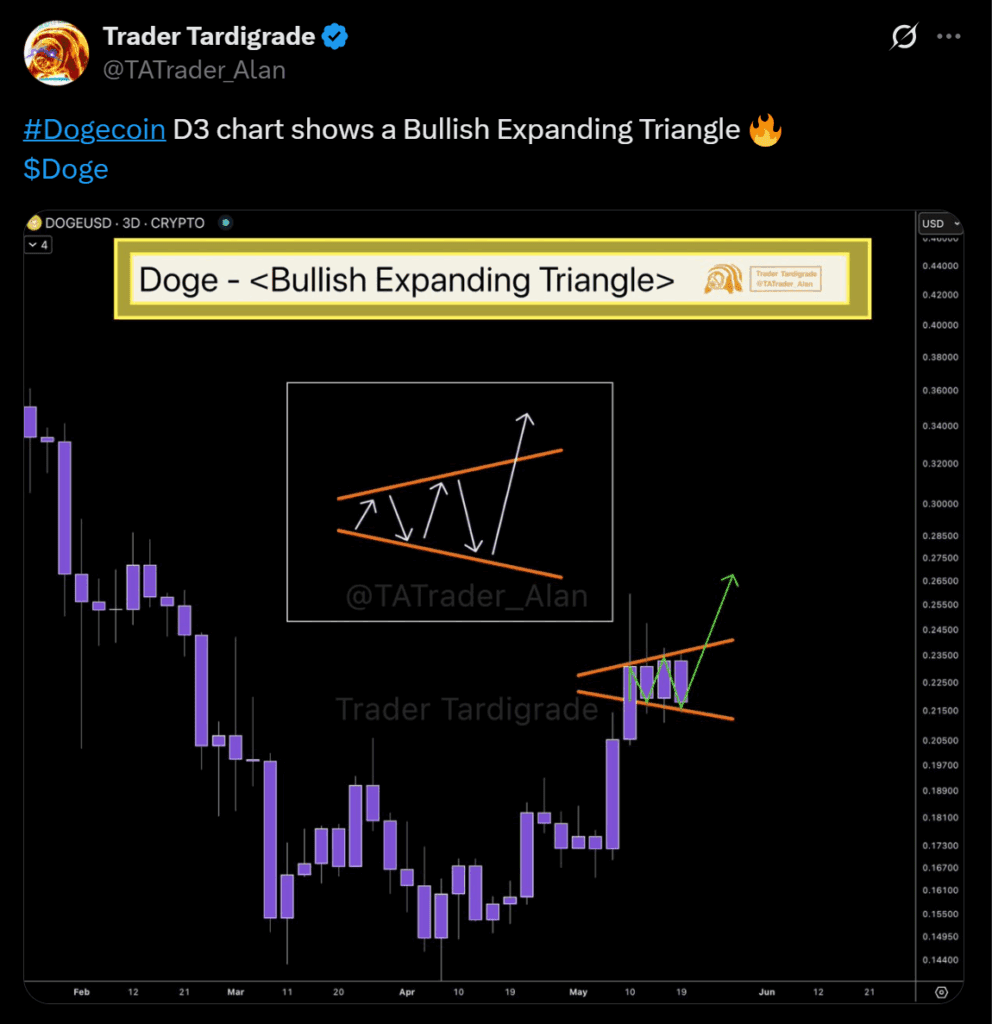
An X-based analyst, going by the name Trader Tardigrade, flagged a Bullish Expanding Triangle on the 3-day chart, showing DOGE pushing against resistance near $0.255. He highlighted higher highs and lower lows, noting the structure could enable a breakout to $0.28 or higher.
The analyst’s chart attracted other DOGE fans across trading circles. While some users cautioned about the token’s reputation and history of scams, the underlying price structure aligned with Dogecoin’s tendency to rally quickly once technical conditions flip.
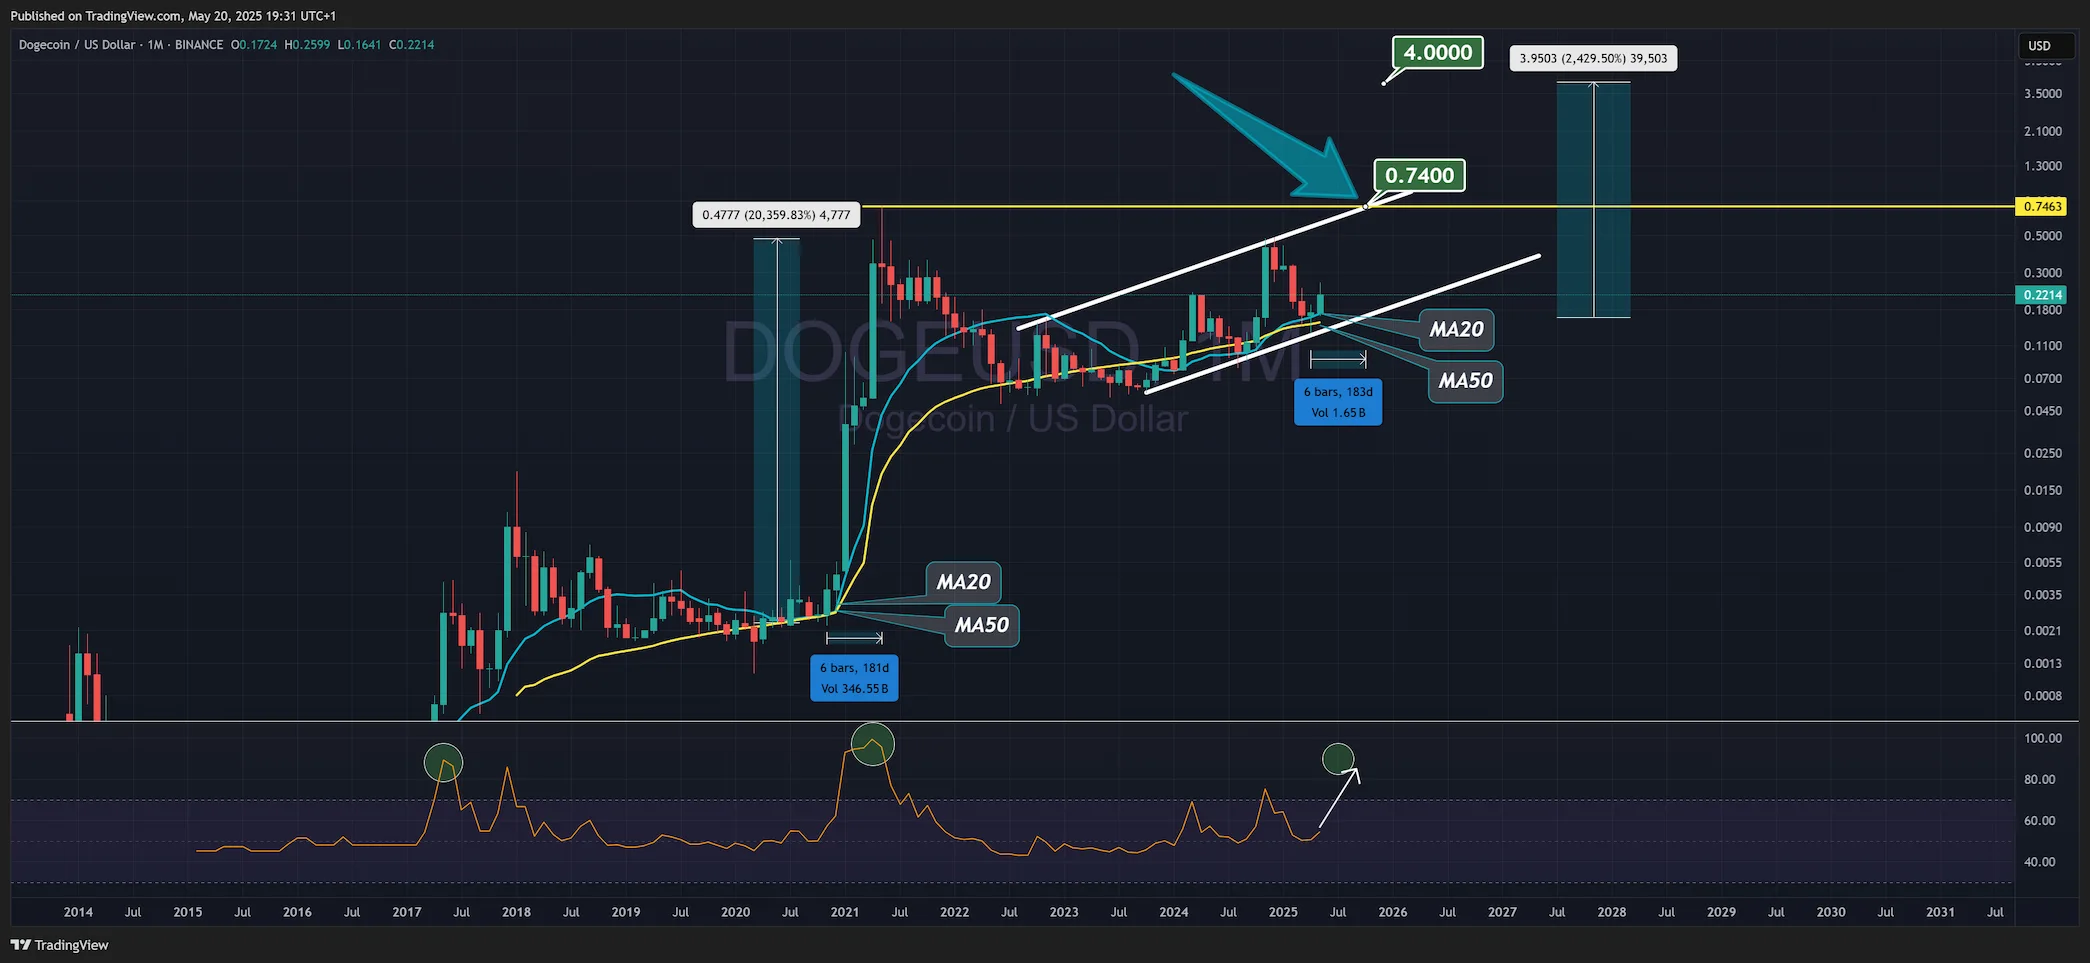
Furthermore, a trader shared a monthly chart showed DOGE holding above its 20-month and 50-month moving averages at $0.1814 and $0.0855. The Relative Strength Index pulled back from overheated levels, settling near 60—well below its 2025 high of 83.4. The author, who posted their analysis on Tradingview, projected a continuation toward Oct. 2025, arguing that the current cycle mirrors 2021’s trendline recovery.
Fundamentals added weight to the bullish thesis. Hyper Bit announced a letter of intent to acquire Dogecoin Mining Technologies Corp., securing 2,660 ElphaPex miners and low-cost access to 11MW of renewable energy.
The move enhances Dogecoin’s network security, hashrate, and perceived legitimacy. The merger, backed by public listings in North America and Europe, marks a rare moment of infrastructure expansion for a meme asset.


