

XRP rose 33.79% over the past seven days, trading at $2.95 on July 14. The breakout followed a confirmed move above the $2.84 resistance level, completing a multi-month triangle pattern. Bitcoin (BTC) gained 14.39% in the same period, reaching an all-time high of $122,091. XRP/BTC also increased by 17% week-on-week, based on Binance data.
Total crypto market capitalization rose from $3.42 trillion to $3.83 trillion. According to TradingView’s TOTAL2 index, the altcoin market cap (excluding Bitcoin) increased from $1.12 trillion to $1.32 trillion.
While Bitcoin’s rally lifted the entire market, XRP’s gains outpaced other major altcoins. However, the strongest indicator behind the move was not price — but the sustained accumulation by large XRP wallets. On-chain data shows that whales added more than 200 million tokens in the past 30 days, indicating long-term confidence ahead of XRP ETF listings.
You May Also Like: Bitcoin Targets $133K After Surprising With July Rally
ProShares XRP ETF Set to Launch July 18 on DTCC
ProShares scheduled the launch of its XRP ETF for July 18, following its listing on the Depository Trust & Clearing Corporation (DTCC). The filing was finalized under Rule 485(b)(1)(iii), confirming readiness for listing.
The fund follows Teucrium’s 2x leveraged XRP ETF (XXRP), which recorded more than $160 million in inflows and gained 55% in one week. XRP ETF filings from Tuttle Capital and Volatility Shares have also received acknowledgment from the U.S. Securities and Exchange Commission (SEC) and await further approval.
The ETF announcements align with U.S. Crypto Week in Washington, D.C., where policymakers will review bills such as the Clarity for Payment Stablecoins Act and the Anti-CBDC Surveillance State Act.
While ETFs have drawn institutional interest, derivatives markets also show increased exposure to token.
Open Interest and Options Activity Point to Rising Bullish Bias
XRP open interest rose 9.47% over the past 24 hours to $1.32 billion, based on Coinglass data. Options volume increased 61.72% to $26.38 million, and options open interest climbed 94.03% to $2.44 million. Funding rates across major platforms turned positive, indicating more demand for long exposure.
Binance’s top trader long/short ratio reached 2.81. Over the same period, $20.34 million in XRP positions were liquidated, with $10.42 million attributed to shorts. This followed XRP’s move above the $2.84 breakout level.
Derivatives data also alogns with wallet-level behavior consistent with large-scale accumulation.
Santiment data shows wallets holding 10 million to 100 million XRP increased their holdings by over 200 million tokens since mid-June. Wallets holding 1 million to 10 million XRP also recorded steady inflows during the same period.

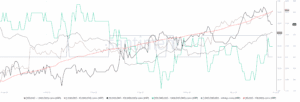
Binance’s XRP reserves fell from over 3.1 billion tokens in January to 2.8 billion this week. The drop in exchange balances indicates reduced circulating supply and accumulation in self-custody wallets.
Whale Transactions Increased Ahead of Breakout
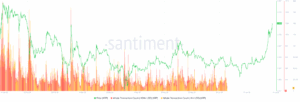
Alongside wallet growth, large-value transactions have also risen.
Transactions exceeding $100,000 and $1 million rose sharply between July 10 and July 14. These spikes occurred around the time XRP cleared multi-month resistance levels.
Exchange inflow data shows Upbit recorded $52.32 million in net inflows, followed by Binance with $2.16 million. Combined spot volume across major exchanges exceeded 70 million XRP on July 14.
Currently, XRP to USD is trading above all major moving averages and RSI has reached 83.58. In previous cycles, similar RSI levels occurred during strong uptrends.
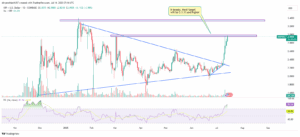
Support remains near $2.70, the lower boundary of the recent breakout zone. Resistance stands at $3.33, last tested in the 2021 cycle. Price structure remains intact unless a breakdown below $2.70 is confirmed on high volume.


