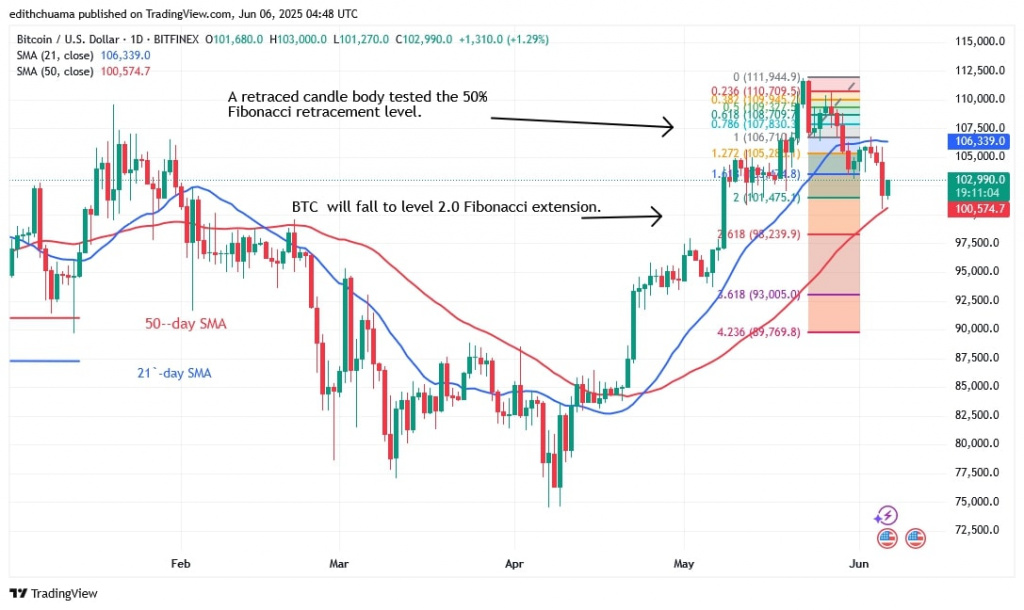
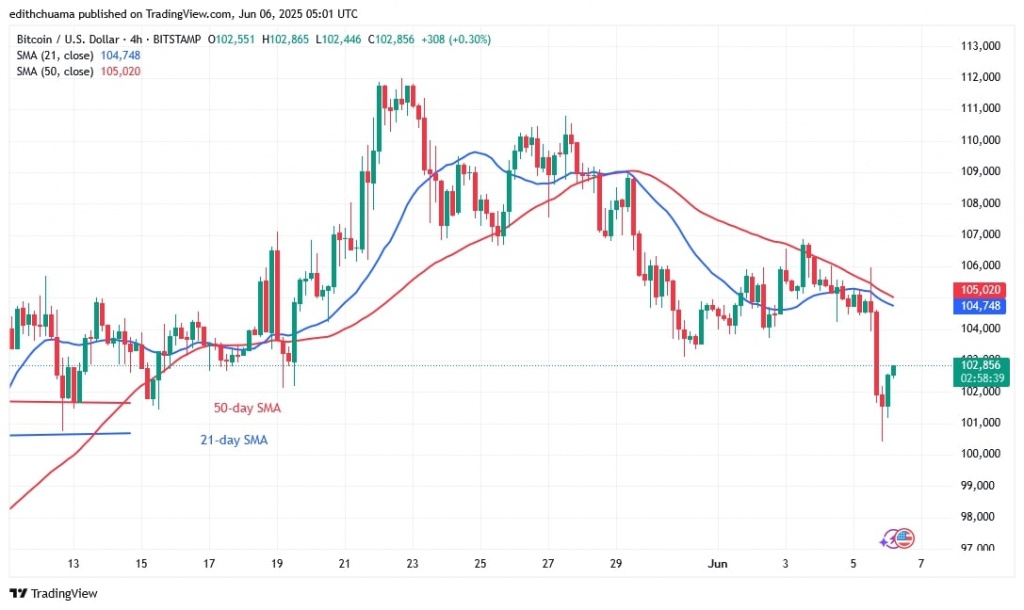
Bitcoin (BTC) has lost the current support at $103,000 and is trading in a narrow range below the resistance at $106,000 or the 21-day Simple Moving Average (SMA) barrier.
Bitcoin price long-term prediction: bearish
Buyers are struggling to push the price above the $106,000 resistance or the 21-day SMA. The largest cryptocurrency will start its uptrend once it breaks above the current barrier. Bitcoin will reach $111,000, its all-time high.
The price has fallen to the psychological price level of $100,000 after the bears broke through the existing support at $103,000. Bitcoin price has remained steady within a limited range in the meantime. Bitcoin is currently valued at $103,640.
BTC price indicators analysis
The price of BTC remains stuck between the moving average lines. The price bars are near the 21-day SMA barrier as the price of the cryptocurrency is retesting it in anticipation of an uptrend. The rising slope of the moving average lines has been maintained.
However, the 4-hour chart shows the current trend with downward sloping moving average lines.
Technical indicators
Key supply zones: $108,000, $109,000, $110,000
Key demand zones: $90,000, $80,000, $70,000

What is the next move for BTC price?
Bitcoin is currently trading sideways after the downtrend came to a halt on May 31, as reported by Coinidol.com. The Bitcoin price is below the $106,000 mark, although it has surpassed the $103,000 mark.
BTC is currently falling back to its current level after today’s upward momentum was pushed back by resistance at $106,000. The Bitcoin price has fallen as existing support has been broken.

Disclaimer. This analysis and forecast are the personal opinions of the author. They are not a recommendation to buy or sell cryptocurrency and should not be viewed as an endorsement by CoinIdol.com. Readers should do their research before investing in funds.


