

Bitcoin’s explosive push to a new intraday peak above $111,800 on May 22 set the backdrop for Raoul Pal’s spirited, two-hour “Drinks With Raoul” livestream. The former hedge-fund macro strategist and Real Vision co-founder insists the rally is still in its early innings. “The Banana Zone has started. Yes, Bitcoin hit an all-time high. Next up, it’s alts… Make sure you’re stacked up on your Bitcoin.”
He defines the “Banana Zone” as the phase when liquidity forces investors out the risk curve. That liquidity, he argued, is coming not from inflation but from looming policy interventions in the bond market.
Why This Bitcoin Cycle Is Different
With the US 10-year yield back above 4.4 %, Pal said the move reflects collateral scarcity, not overheating prices:“Bond yields are going up. Normally that’s not a good thing… But inflation is falling all the time. The story is liquidity. There’s a lack of liquidity in the bond market, and when yields get too high the government’s reaction function is always and in every case to print more money.”
He predicted the Federal Reserve will either relax the supplementary leverage ratio (SLR) to let primary dealers absorb Treasuries or “dress up” a form of yield-curve control: “By July they’ll be using the SLR to allow banks to hold more bonds. That is code for, ‘Hey, stick bonds on your balance sheet, give some leverage out into the world, and—hey presto—new buyers of bonds.’ If that’s not enough, they’ll slap a four-letter acronym on yield-curve control and pretend it’s something new.”
Such measures, he said, “remove the left-tail risk” and turbo-charge scarce assets. “It’s exactly what happened in 2017. Stocks, gold, and especially Bitcoin went to the moon.”
Pal devoted several minutes to a comparative dollar chart: “Trump’s first [term] saw the dollar fall hard. Guess what? It’s replaying faster now… A weak dollar is the key to making the world go round. The 12-month gain in Bitcoin after big dollar drops has been 119%, 175%, even 592%. That’s the denominator effect.”
He rejected tariff-war fears as noise: “It’s just negotiation. They’ll agree something sensible because the US is in the business of selling bonds, not blowing up trade.”
While celebrating Bitcoin’s milestone, Pal argued that Ethereum and high-beta Layer-1s stand to outperform once the ISM manufacturing index—currently languishing below 50—turns up: “The financial-conditions index I track is screaming higher and leads ISM by nine months. When ISM crosses 50 on the upside, that’s when you get alt-season. The ETH-BTC ratio is basing; Bitcoin dominance has peaked.”
Solana, SUI, Dogecoin And $140,000 Per BTC
He pointed to Solana and Sui charts “forming classic cup-and-handles,” then offered a tongue-in-cheek take on Dogecoin: “The funniest outcome is Doge eventually outperforming Bitcoin from inception and becoming the hardest currency in the world. That will upset a lot of people—but the chart says it’s possible.”
Despite the exuberance, Pal inserted a timing caveat linked to his global-M2 model: “Liquidity says we should be over $140,000 by July. But July–August could be a sideways ‘correction phase 2’ as the dollar reflex-rallies. That’s the spot to take lifestyle chips off the table—if you want. Nothing about the broader cycle changes.”
He reiterated that the full Banana Zone stretches into 2026, barring an unforeseen policy shock: “Every cycle people scream ‘diminishing returns.’ Every cycle they’re wrong.”
Pal’s thesis boils down to three interlocking forces: policy-driven liquidity, a structurally weaker dollar, and bond-market triage that funnels capital into scarce assets. Whether traders accept the “Banana Zone” branding or not, markets appear aligned. “I’ve been telling the same story since the 2022 low—and luckily it’s been right,” Pal concluded. “You can ignore the wine recommendations, but don’t ignore the liquidity charts.”
For investors, the message is clear: if the bond market forces the Fed’s hand, the path of least resistance for Bitcoin—and soon, perhaps, for Ether and its brethren—remains upward.
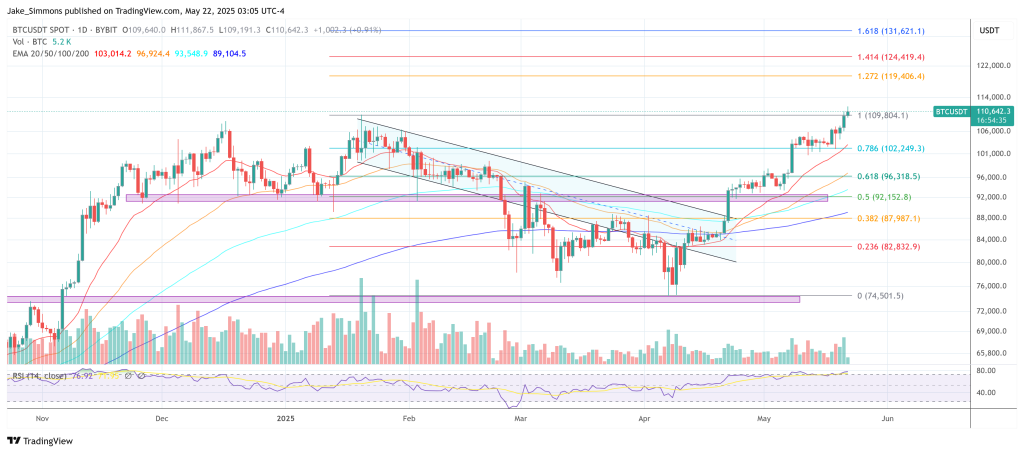
At press time, BTC traded at $110,642.
Featured image created with DALL.E, chart from TradingView.com

Editorial Process for bitcoinist is centered on delivering thoroughly researched, accurate, and unbiased content. We uphold strict sourcing standards, and each page undergoes diligent review by our team of top technology experts and seasoned editors. This process ensures the integrity, relevance, and value of our content for our readers.


 Blockchain")
