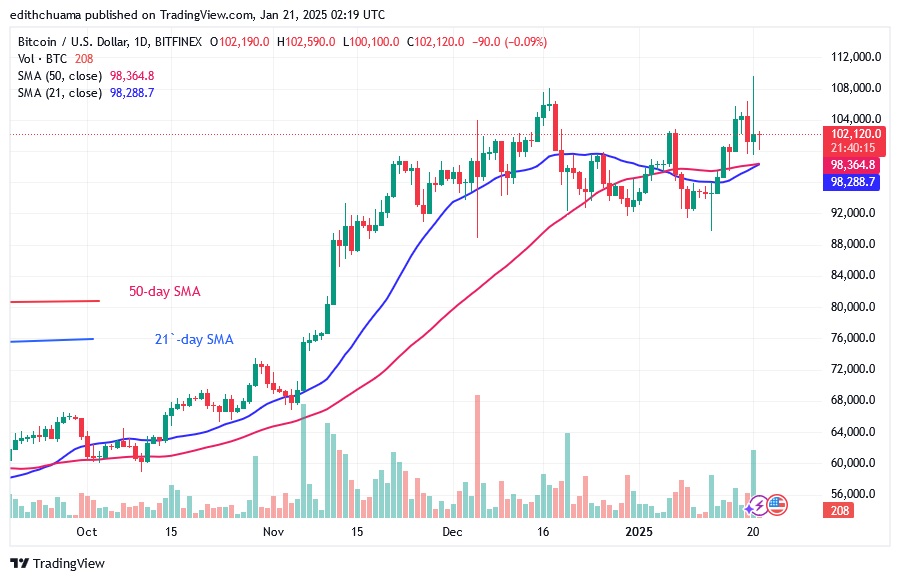
Cryptocurrency analysts of Coinidol.com report, the price of Bitcoin (BTC) has risen above the moving average lines after a strong bounce.
Bitcoin price long term prediction: bullish
The largest cryptocurrency rose above the moving average lines and crossed the $100,000 mark. However, the upward momentum was halted at a high of $104,000. On January 20, the upward momentum continued to increase, surpassing the $104,000 mark and reaching a high of $109,590. However, the BTC price was pushed back again at the high of $109,590 and fell well above the support level of $100,000.
Today, Bitcoin is trading above the moving average lines but below the resistance level of $104,000. The largest cryptocurrency is currently gradually rising upwards. If buyers overcome the resistach a high of $116,000. However, if buyers are unable ance levels at $104,960 and $108,000, Bitcoin could reto overcome the resistance levels, Bitcoin will be forced to trade in a range above the moving average lines.
Bitcoin indicator reading
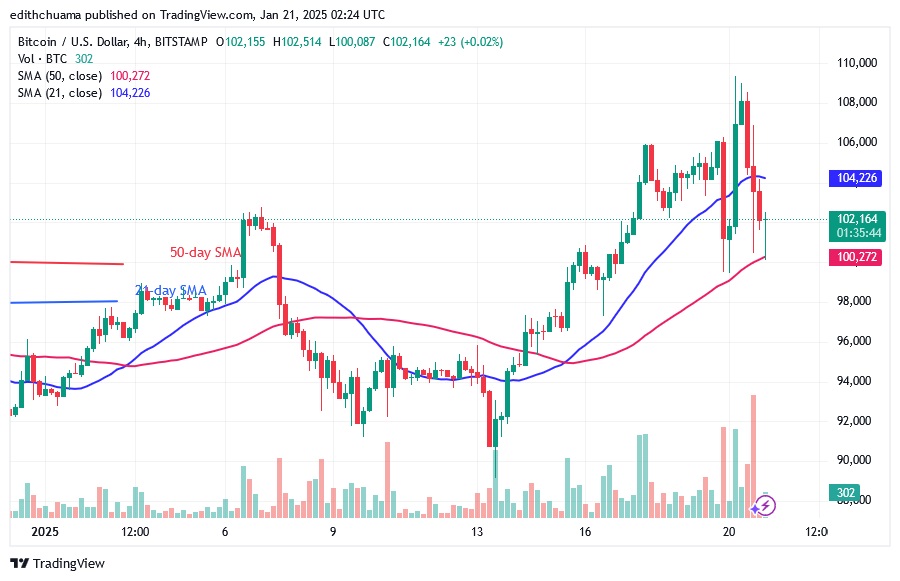
Bitcoin is expected to rise as the price bars are above the moving average lines. However, on January 20, a long candlestick wick points to the high of $109,000. The long candlestick wick indicates significant selling pressure at a high of $109,000. On the 4-hour chart, Bitcoin is trapped between the moving average lines, indicating a range-bound move for the cryptocurrency.

Technical indicators:
Key resistance levels – $90,000 and $110,000
Key support levels – $70,000 and $50,000
What is the next move for BTC/USD?
The 4-hour chart shows that Bitcoin is trapped above the 50-day SMA support but below the 21-day SMA resistance. Bitcoin will fall if the bears break the 50-day SMA. Bitcoin will fall and retest the support at $90,000. On the other hand, Bitcoin will resume its uptrend once it breaks above the 21-day moving average. The current fluctuations will continue if the 21- and 50-day SMAs remain unbroken.

Disclaimer. This analysis and forecast are the personal opinions of the author. They are not a recommendation to buy or sell cryptocurrency and should not be viewed as an endorsement by CoinIdol.com. Readers should do their research before investing in funds.


