
, SUI, and TRUMP Bulls Optimistic, But Prices Continu…")
Cardano (ADA), Sui (SUI), and TrumpCoin (TRUMP) remained trapped in a downtrend, and the recent market drawdown did not help their cause either. However, analysts and traders are relying on technical patterns and speculation to keep the bullish sentiment alive.
ADA price rebounded from the $0.51 support zone on June 22 and entered a sideways structure. Despite the downtrend, the Cardano token has painted its first green candle on the weekly charts after six consecutive weeks of losses.
SUI price recovered nearly all of its losses from last weekend’s market plunge, but has since been paring gains. On June 27, the token rallied over 2% to reach a high near $2.67.
Meanwhile, TRUMP price action remained very muted, with minuscule daily candles showing the apathy from market participants. Any cues to the token’s likely price movement could attract traders into entering the market. The broader market traded flat, with Bitcoin hovering near the $107,000 level and spot volumes still thin.
ADA’s Critical Range Holds, But Bullish Path Hinges on October Breakout
Cardano’s ADA token is clinging to a crucial accumulation zone just above $0.51, as multiple analysts project a slow-burning bottom phase similar to past cycles.
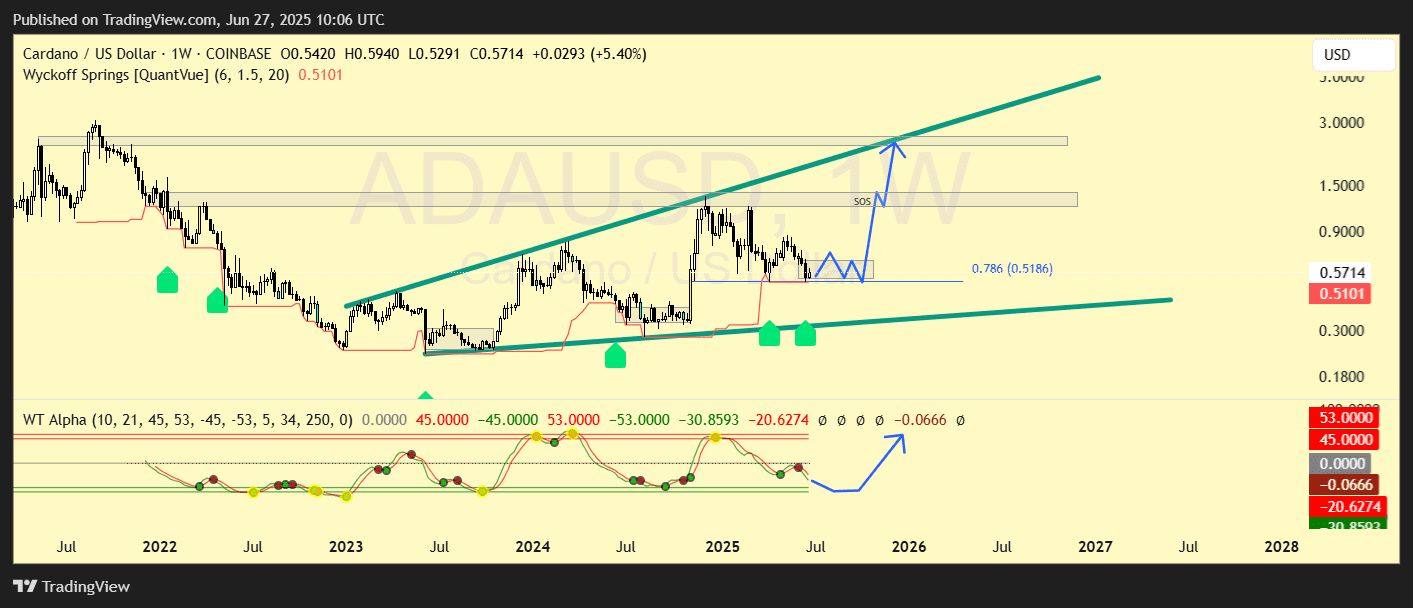
SSR_Trades highlighted a potential Wyckoff-style double spring near the 0.786 Fibonacci retracement level (around $0.518), projecting a rangebound ADA through October before a 4x–5x rally. This historical echo theory aligns with earlier bull phases that followed months of sideways action.
According to the SSR_Trades post, a move to the predicted price could see the ADA USD pair rise to $2.5, spiking nearly 400% along the way. However, that is a theoretical target. For now, bulls would likely try to push ADA price above $1.
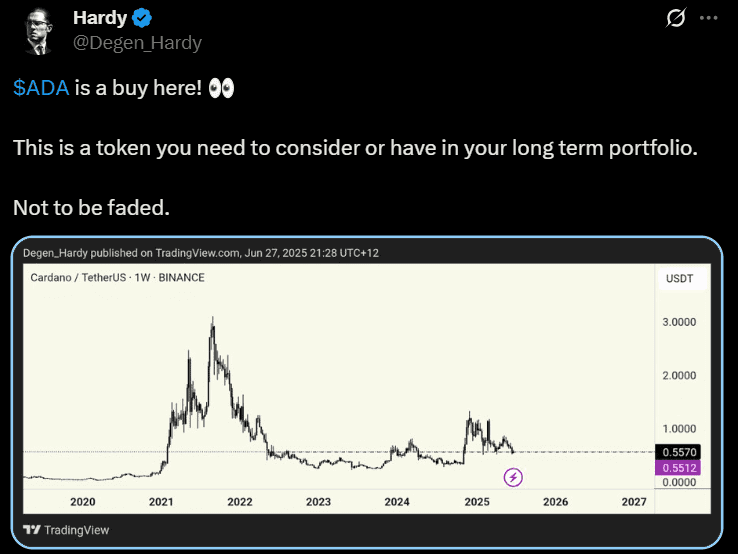
X-based crypto analyst Hardy echoed the long-term bullish view, stating ADA is a “buy here” while pointing to the token’s past accumulation floor—roughly the same level now under stress. However, not all sentiment is blindly optimistic. Man of Bitcoin flagged the loss of micro support on ADA’s lower timeframes, suggesting a risk of fresh lows unless the $0.512 threshold holds.
On-chain and infrastructure updates may help counterbalance near-term price weakness.
Coinbase’s recent decision to launch cbADA on its Base L2 chain has placed ADA inside Ethereum’s DeFi infrastructure, broadening its future use cases. The move hints at increasing institutional focus on the token despite its weak spot price.
Until ADA reclaims its macro trendline and breaks out with substantial volume, traders appear split between cyclical optimism and short-term caution.
SUI Bulls Aim Higher After Breakout and Institutional Nod
SUI price action has flipped bullish after confirming a breakout from its descending triangle, with price now retesting the $2.50–$2.60 zone.
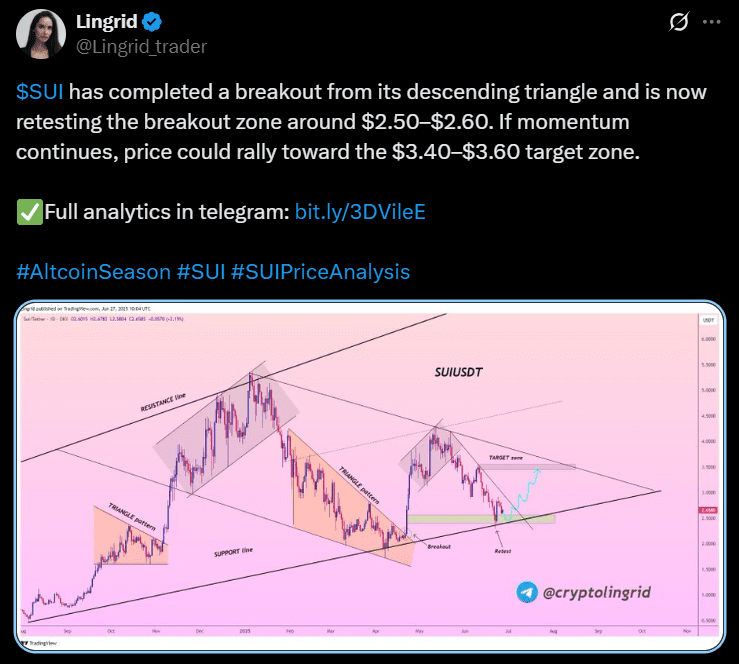
A crypto trader on X shared a chart outlining the breakout-retest pattern, calling for a possible rally toward the $3.40–$3.60 region if momentum is sustained.
The structure aligns with Maddox’s Elliott Wave thesis, which suggests SUI USD pair has completed a wave 2 pullback at the 0.786 Fibonacci retracement.
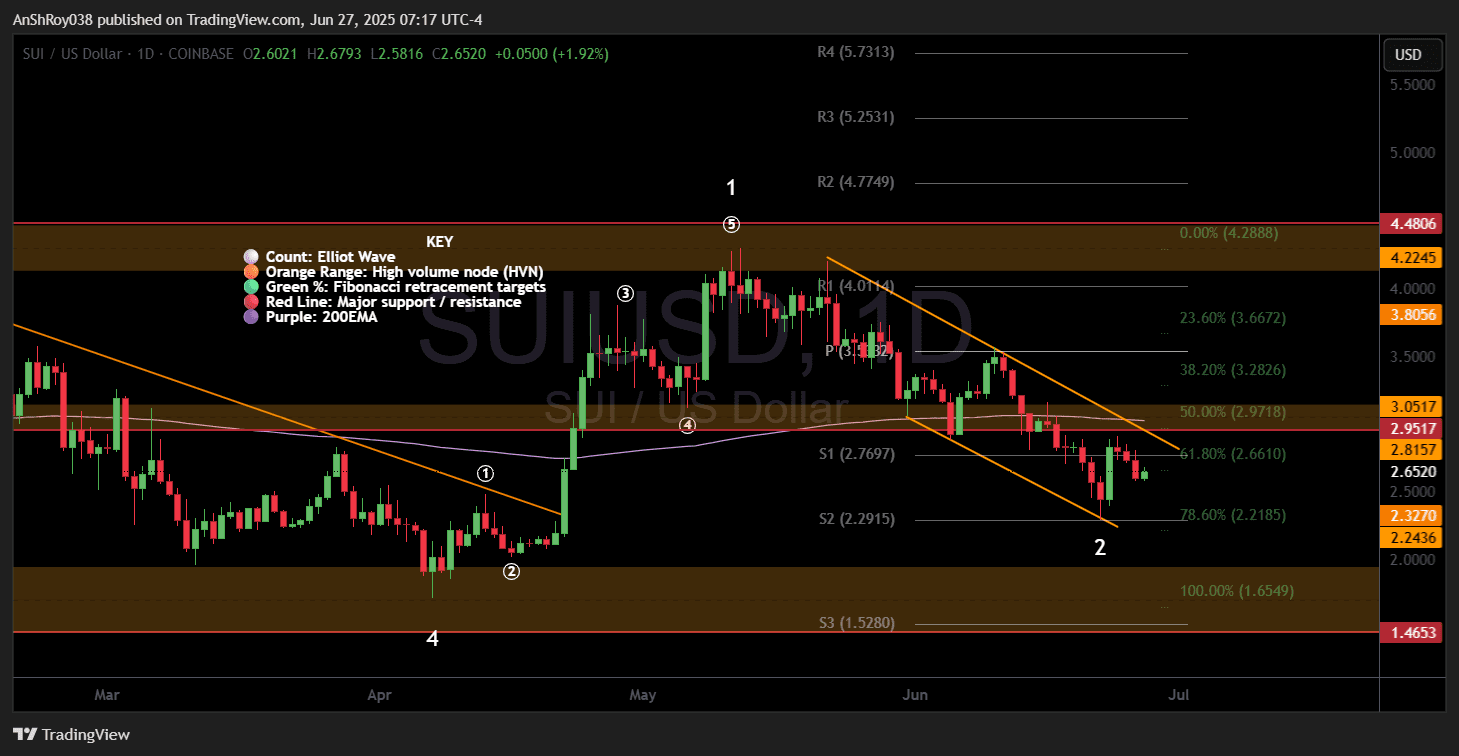
His chart also shows a bullish engulfing candle forming at the S2 daily pivot ($2.29), reinforcing the recovery zone. A breakout above the descending orange trendline remains the next key trigger, though Maddox warns that the setup would be invalidated on a drop below $2.28.
Outside the charts, Grayscale added SUI to its ‘Top 5 picks for Q3 2025,’ grouping it alongside Bitcoin, Ethereum, Solana, and Hyperliquid. The asset was flagged for its role in smart contract infrastructure, signaling that institutional eyes are turning toward the ecosystem. The inclusion could boost investor confidence even if near-term volatility remains.
Reclaiming the 200-day EMA and flipping $2.95 into support may trigger the bulls’ next leg higher. However, momentum could quickly unwind if the SUI price fails to hold its retest zone.
However, like ADA, SUI bulls would need to push the prices higher with conviction to start a rally.
TRUMP Faces Hurdles Despite Bullish Setups on Lower Timeframes
TRUMP price has sparked renewed interest after reclaiming the $8.50–$9.00 zone. Traders on social media platforms shared very optimistic posts, speculating a jump to $15 or above for the memecoin.
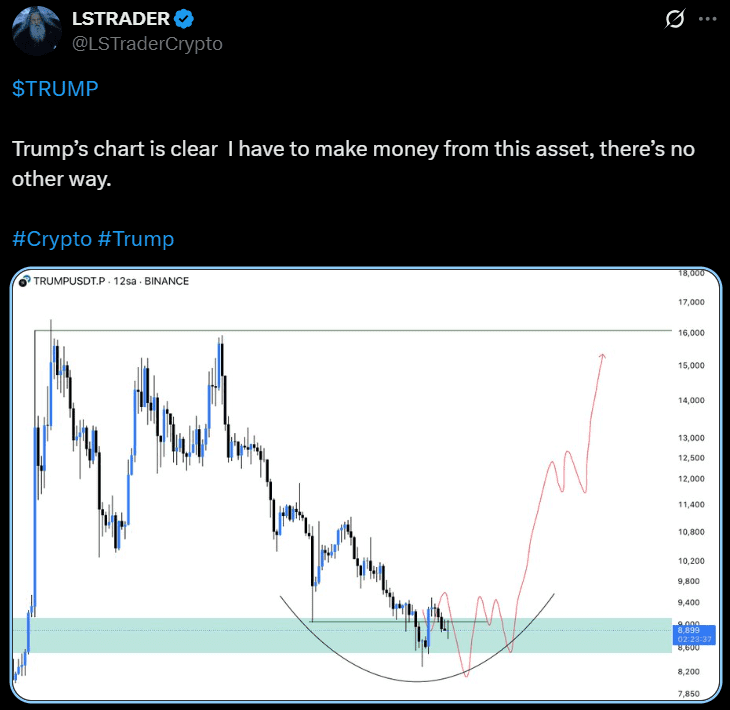
A trader with the X username LSTRADER shared a rounded bottom structure with a projected move toward $15, indicating a full recovery toward previous local highs. However, the chart lacks volume confirmation or structural retests to support the steep trajectory, making the projection more aspirational than actionable at this stage.
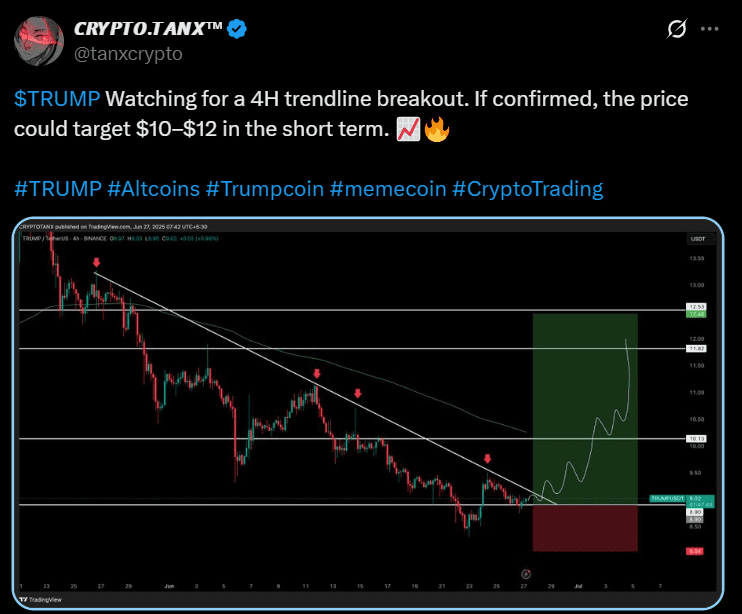
Meanwhile, another trader, Crypto.Tanx shared a post showing a descending trendline break with near-term targets between $10.13 and $12.53. The setup is backed by a risk-reward box and multiple rejection points along the former trendline. These add legitimacy to the breakout claim. Still, momentum remains tentative. The price has not yet flipped the $10.13 level into support.
While both traders argue for a bullish reversal, neither chart confirms strong follow-through volume or macro trend shifts. Until TRUMP clears $12 with conviction or reclaims weekly structure, projections beyond that range remain speculative.
ADA, SUI, and TRUMP seem to be consolidating for the moment.


