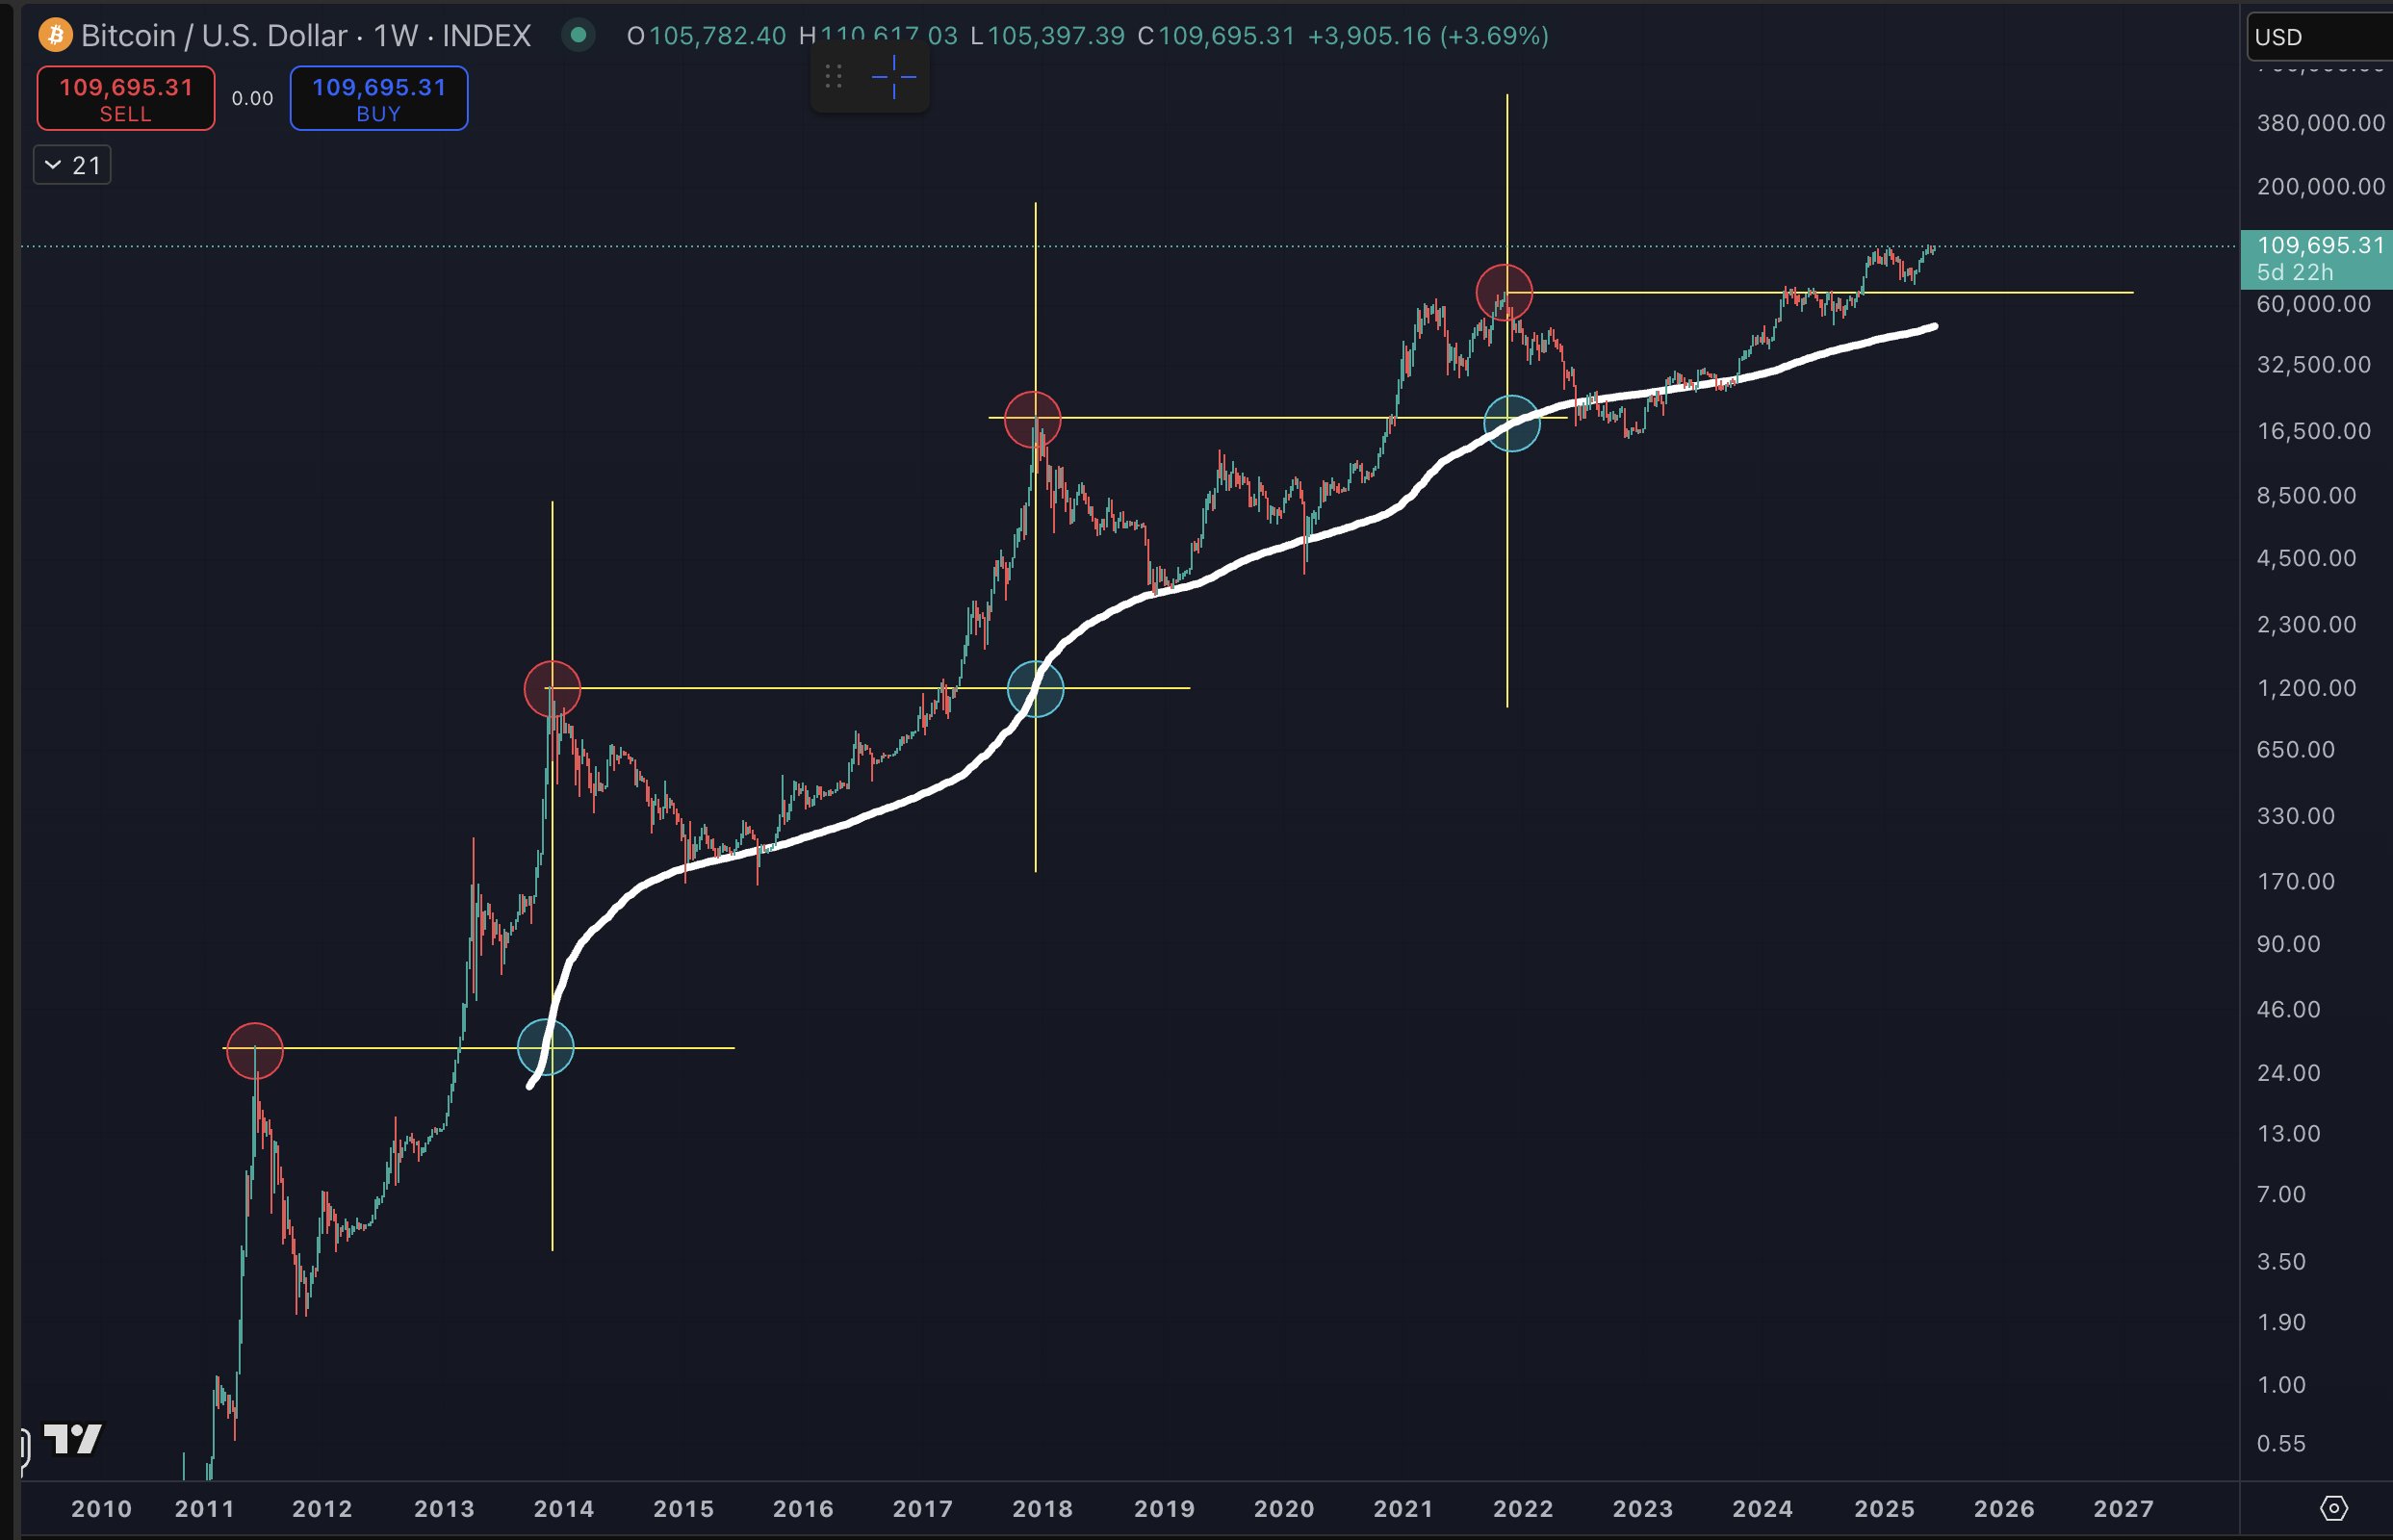
A top market analyst has highlighted how the movement of the 200W SMA indicator has marked the cyclical top for Bitcoin and what it means for current prices.
Benjamin Cowen, the founder of Into The Cryptoverse, identified this trend in an X post on June 10. He drew the data from Bitcoin’s historical tops in correlation with the 200-week simple moving average (SMA), emphasizing how it affects current prices.
This follows Bitcoin’s close above $110,000 yesterday. The leading cryptocurrency by market cap rallied 4% on Monday to an intraday high of $110,617 before moving a bit lower.
Bitcoin Cyclical Top’s Correlation With the 200W SMA
Cowen noted that Bitcoin’s price action and the 200-week SMA have a pattern: the indicator has consistently predicted its cyclical top. For the uninitiated, the moving average calculates the average closing price of Bitcoin over the past 200 weeks.
Historically, BTC usually reaches its top for the cycle when the weekly indicator crosses its all-time high from the previous cycle.
An accompanying chart further confirms this correlation. For perspective, Bitcoin topped at $1,242 in November 2013 when the 200W SMA crossed its previous high. The same happened with the ATH of $19,804 in December 2017. Specifically, the 2017 cycle peak occurred when the 200W SMA reached $1,157, aligning with the $1,242 ATH from 2013.
This pattern also played out with the $69,000 peak price in November 2021. Notably, when Bitcoin hit the November 2021 high of $69,000, the 200W SMA had climbed close to the previous cycle’s peak. This marked the top for the 2021 bull run.

More Upsides for Bitcoin?
Meanwhile, according to the chart, the 200W moving average has yet to reach 2021’s ATH. In fact, the chart shows it has more ground to cover to get the extended line from the price high. For context, the 200W SMA stands at $48,353, a difference of $20,644 from the 2021’s peak of $68,997.
As a result, Cowen’s analysis suggests Bitcoin has more upside from here. While he did not mention a specific price target in the Tuesday analysis, he stressed it is “something to keep in mind.”
Interestingly, other analyses align with this bullish outlook. Earlier, Klarch highlighted a similar cyclical recurrence in Bitcoin, suggesting further upside to $180,000 per coin.
His optimism hinges on the idea that, according to the cyclical timeline, there is more time for further upside and continued capital influx into the crypto market.
Furthermore, other bullish predictions, including a rally to $200,000 and $250,000, remain in place. In the meantime, Bitcoin trades at $109,274, with its market cap surpassing $2.1 trillion.
DisClamier: This content is informational and should not be considered financial advice. The views expressed in this article may include the author’s personal opinions and do not reflect The Crypto Basic opinion. Readers are encouraged to do thorough research before making any investment decisions. The Crypto Basic is not responsible for any financial losses.


