
 Skyrockets 152%, Forms Bullish Wedge Targeting 657…")
On June 5, 2025, the RVN/USDT pair jumped 152.52% in just one day, rising from around $0.011 to a high near $0.0278. The spike came with a trading volume of 6.73 billion. However, the price quickly pulled back the next day and now trades near $0.01446, giving up more than half of the gains.
On June 6, 2025, the RVN/USDT weekly chart created a bullish falling wedge pattern.
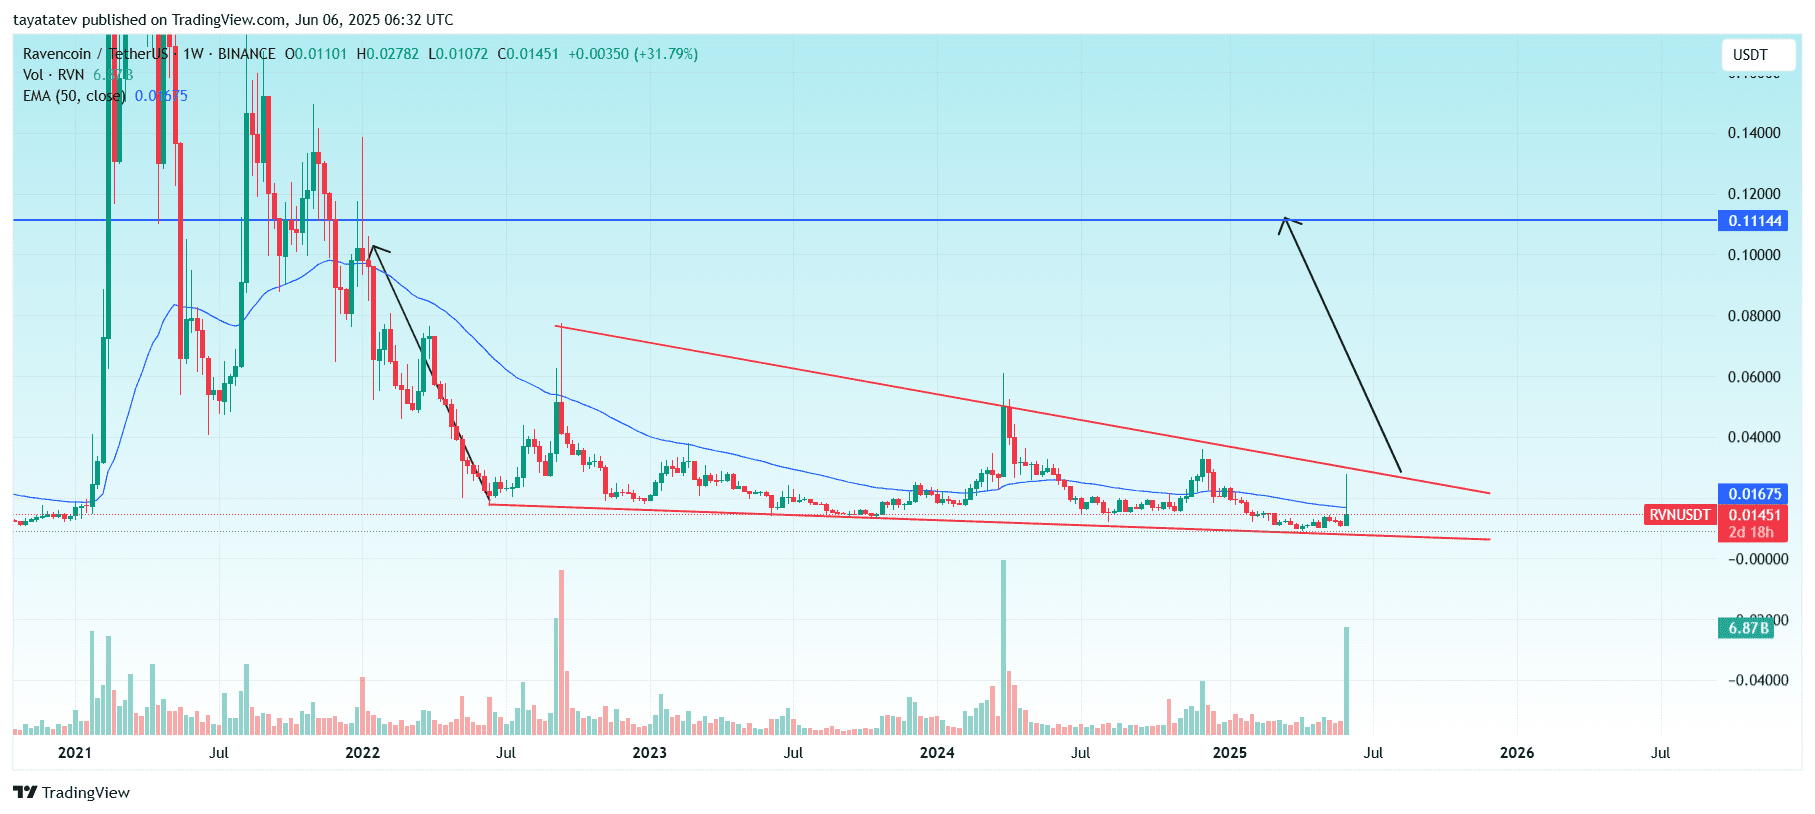
A bullish falling wedge is a chart pattern formed by converging downward-sloping trendlines, usually signaling a potential trend reversal to the upside.
If this pattern confirms, the RVN/USDT price can surge 657% from the current level of $0.01451 to the projected target of around $0.11144.
This pattern developed after a long downtrend from its 2021 highs. The wedge’s resistance line, marked in red, has been touched multiple times over the past two years. The recent breakout attempt came with a spike in weekly volume, which jumped to 6.87 billion RVN, indicating strong buying pressure.
Moreover, the price has now closed above the 50-week Exponential Moving Average (EMA), currently near $0.01675, for the first time since early 2023. This breakout above EMA and wedge resistance strengthens the case for a potential bullish reversal.
If the price holds above this range and gains momentum, a rally toward the wedge’s projected target remains possible.
RVN/USDT DMI Flashes Strong Trend Signal as ADX Surges
The RVN/USDT Directional Movement Index (DMI) showed a clear trend reversal signal on the weekly timeframe.
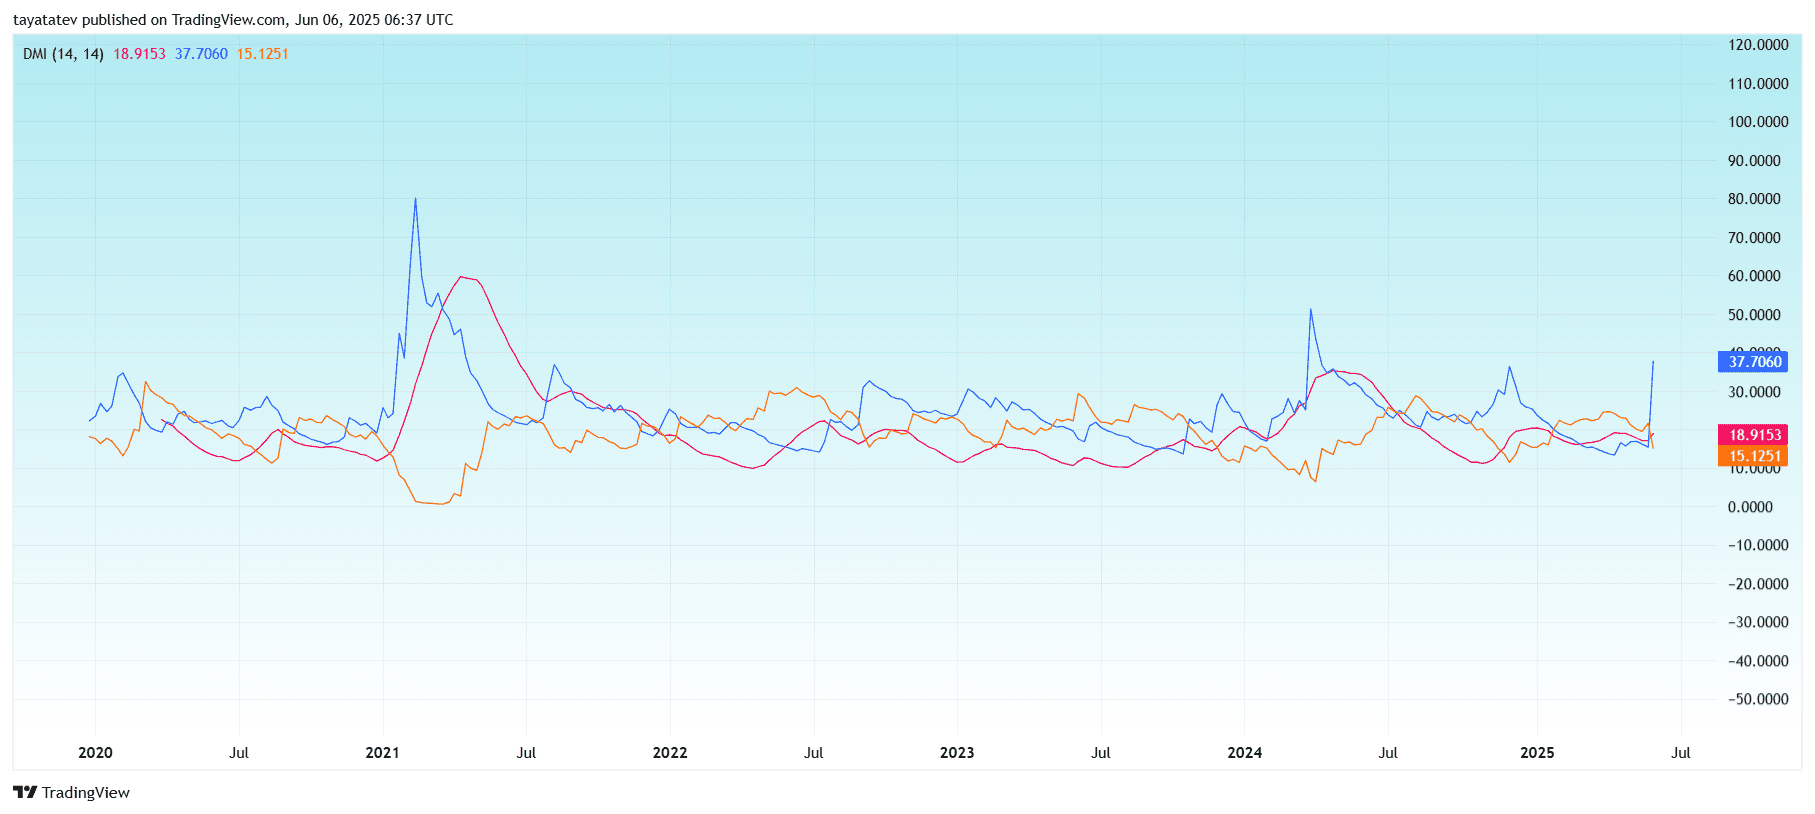
The Average Directional Index (ADX), marked in blue, surged to 37.71, crossing the key 25 level. This move signals a strong trend forming. The ADX measures trend strength regardless of direction. A reading above 25 confirms a valid trend.
The +DI (positive directional index), shown in orange, sits at 15.13, while the –DI (negative directional index), shown in red, is higher at 18.92. This setup means sellers still slightly dominate in terms of directional pressure, but the strong ADX rise indicates that a major trend shift could be underway if +DI crosses above –DI.
Throughout 2024 and early 2025, the ADX remained mostly flat, reflecting a sideways market. But the sharp vertical rise now aligns with the breakout seen on the price chart, confirming that momentum is building.
If +DI overtakes –DI in the coming weeks, and the ADX continues rising, it will validate a sustained bullish move in RVN/USDT.
RVN/USDT RSI Nears Midpoint as Momentum Builds
On June 6, 2025, the Relative Strength Index (RSI) for RVN/USDT on the weekly chart printed 49.99, while the RSI-based moving average stood at 40.27.
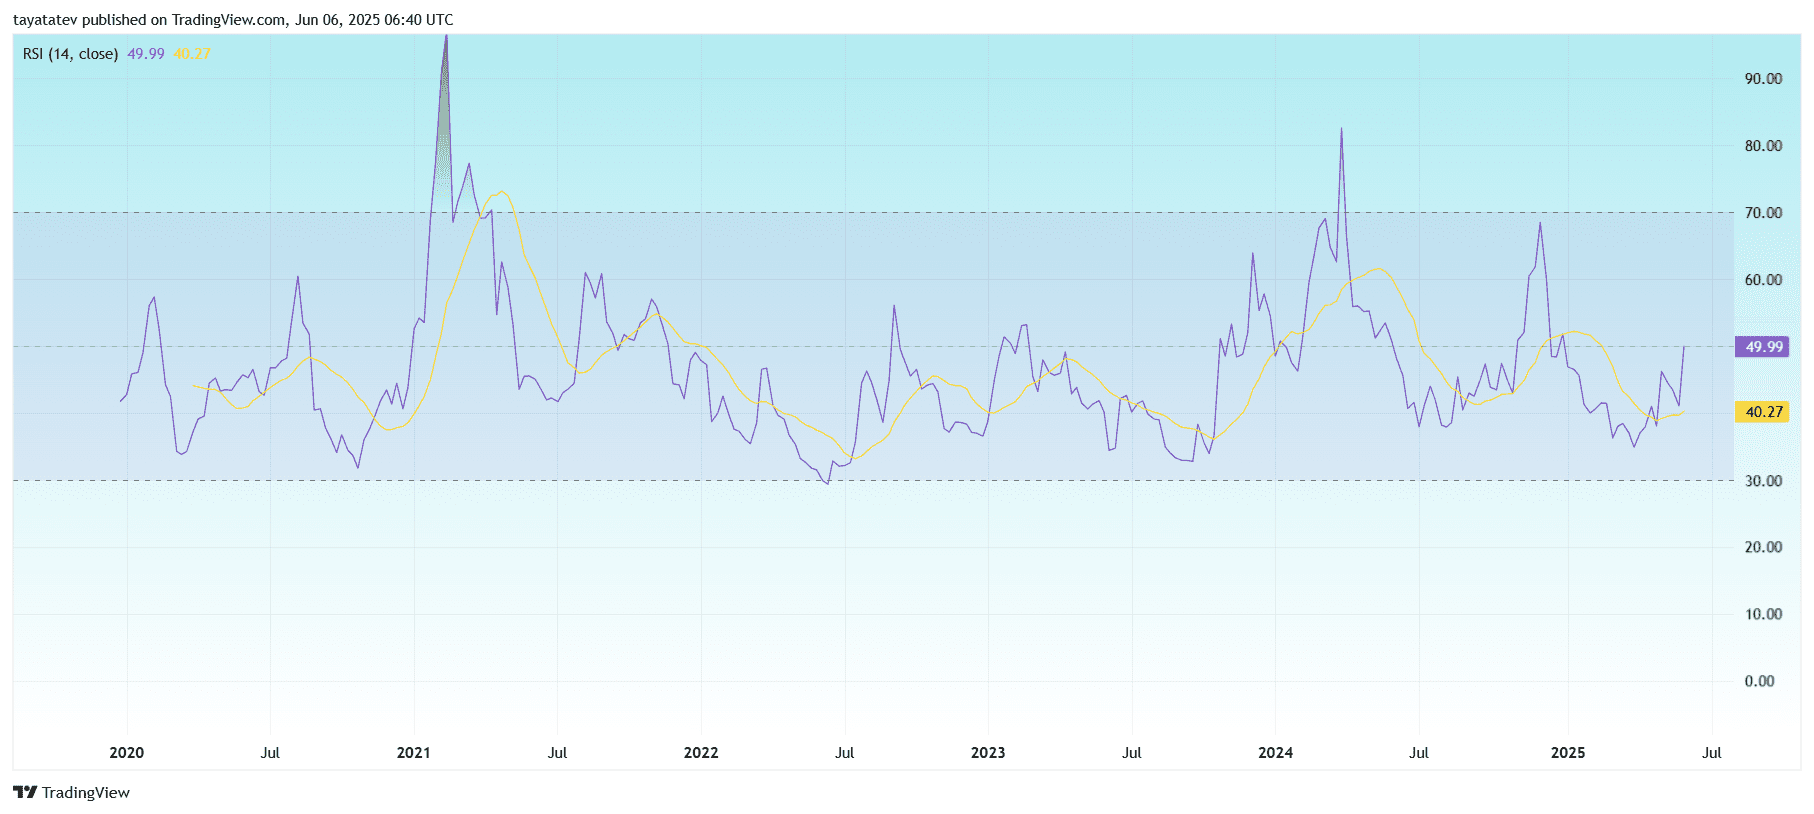
The RSI measures the speed and change of price movements on a scale of 0 to 100. A reading below 30 signals oversold conditions, while a reading above 70 signals overbought. A level near 50 indicates neutral momentum with a potential shift depending on price direction.
Currently, the RSI has crossed above its own moving average, suggesting a short-term momentum shift to the upside. It also approached the midpoint (50), which often acts as a pivot between bearish and bullish zones.
This crossover follows a long consolidation period with several failed breakout attempts in 2024 and early 2025. The recent upward RSI slope aligns with the falling wedge breakout and high volume spike seen on the weekly price chart.
If the RSI breaks and holds above 50 in the coming weeks, it may confirm a stronger bullish trend forming.
RVN/USDT MACD Approaches Bullish Crossover on Weekly Chart
On June 6, 2025, the RVN/USDT weekly Moving Average Convergence Divergence (MACD) indicator showed early signs of a potential bullish shift.
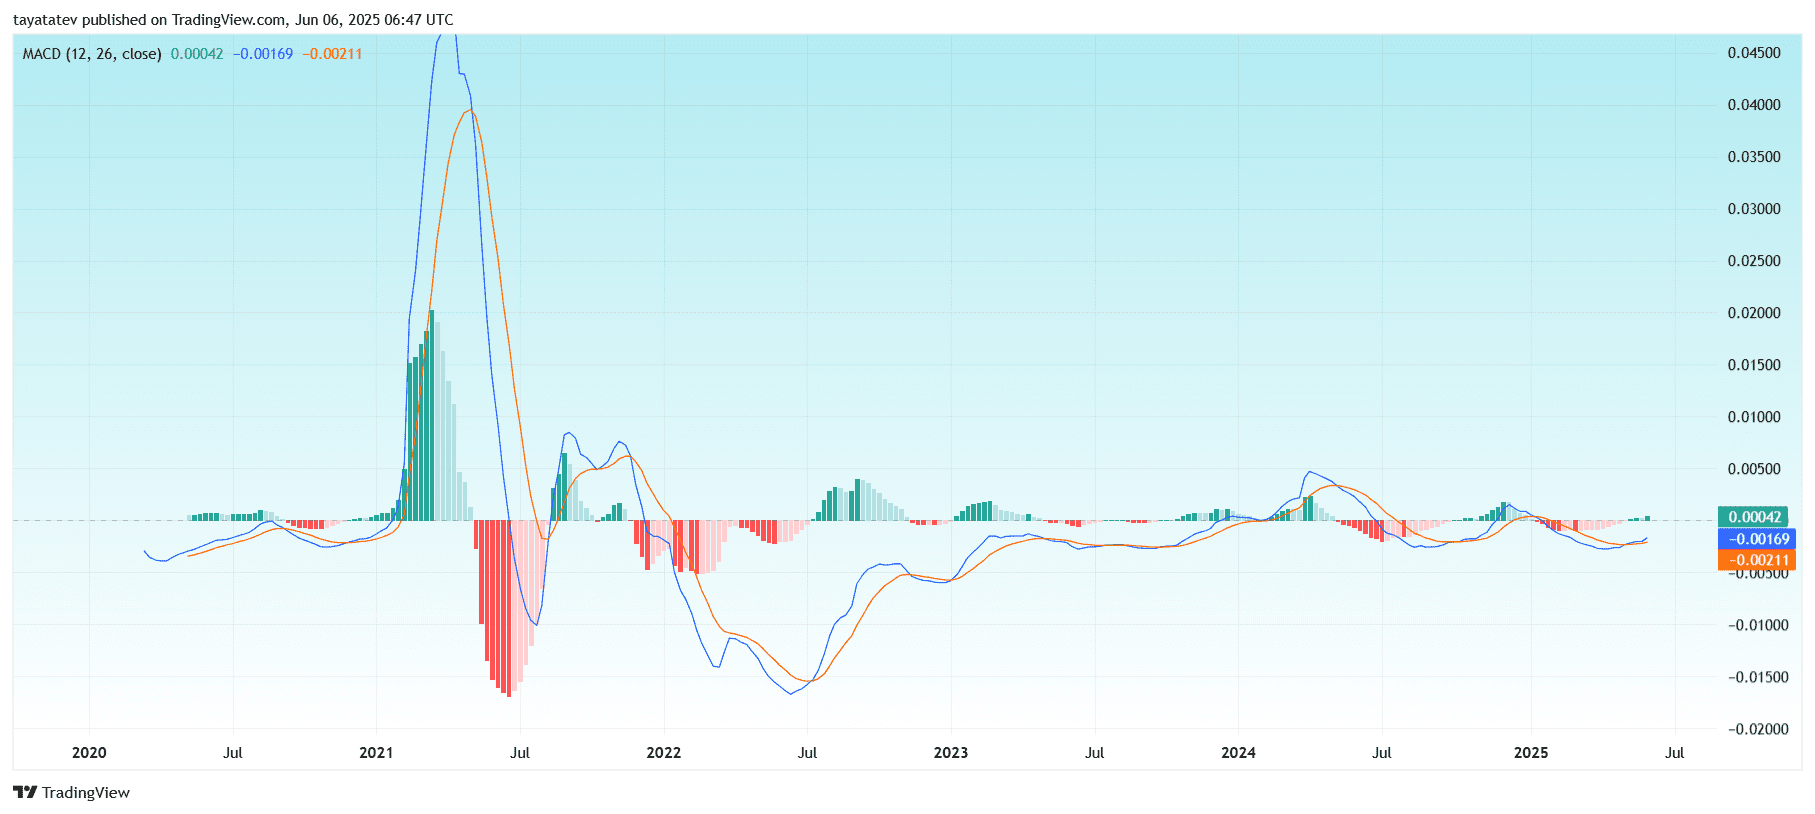
The MACD line (blue) is now at −0.00169, while the signal line (orange) is at −0.00211. Although both values remain below the zero line, the MACD line has crossed above the signal line for the first time in months. This crossover indicates an early bullish momentum signal.
At the same time, the MACD histogram has flipped slightly positive, currently printing +0.00042. A green histogram above the zero level confirms the crossover and supports a possible trend reversal.
Historically, strong uptrends in RVN/USDT have followed sustained MACD crossovers and green histograms. Previous bullish waves in 2021 and early 2023 began with similar crossovers.
If the MACD continues rising and crosses the neutral zero line, it would further confirm a momentum shift toward a full bullish cycle.
RVN/USDT Weekly SMI Pulls Back After Sharp Rebound
Meanwhile, the Stochastic Momentum Index (SMI) for RVN/USDT showed a slight pullback after a strong recovery from oversold territory.
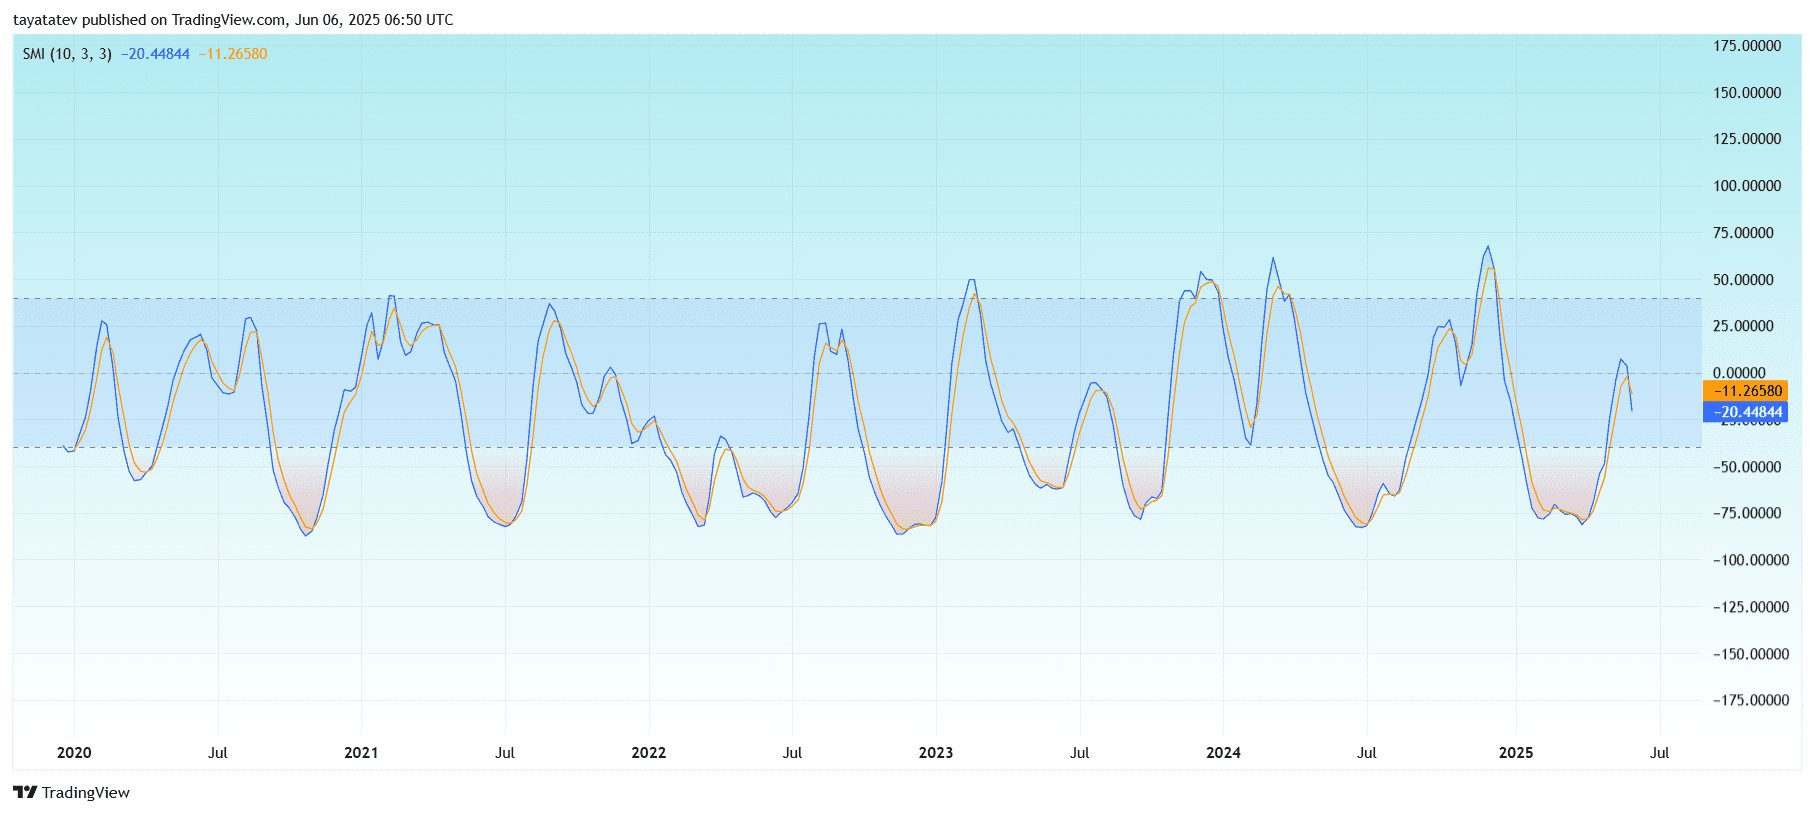
The SMI blue line currently reads −20.45, while the orange signal line is at −11.27. Both lines have turned downward after a steep rise, indicating a brief loss of momentum following the price spike seen earlier this week.
The SMI measures closing price momentum relative to the median of the high/low range and is more refined than the traditional Stochastic Oscillator. Values above +40 suggest strong upward momentum, while values below −40 indicate strong downward momentum.
Earlier, RVN/USDT’s SMI had crossed above −40 and moved toward the zero line, showing initial bullish momentum. However, the latest dip suggests consolidation or hesitation among buyers. For trend continuation, the blue line must turn upward and break above the signal line again.
This brief SMI rejection echoes the short-term price retracement after RVN’s 152% breakout.


")

