

On June 13, several firms updated their Solana ETF filings with the U.S. Securities and Exchange Commission (SEC). The changes aim to answer the SEC’s earlier questions. However, the regulator is not in a hurry to approve them, according to a source who spoke to Reuters.
The updated filings came from multiple applicants, including Canary’s Marinade Solana ETF, the 21Shares Core Solana ETF, and the Bitwise Solana ETF.
These companies hope to launch exchange-traded funds that track the price of the Solana token. While the amendments are meant to move the process forward, there’s still no timeline for when—or if—the SEC will approve them.
X Suspends Multiple Solana Projects, Including Pump.Fun, Over API Misuse and Policy Concerns
On June 17, several Solana-based crypto projects lost access to their official X accounts. The suspended accounts include meme token platform Pump.Fun, GMGN, BullX, and Eliza OS. X did not give a public explanation for the bans, leaving the crypto community confused.
The most discussed theory centers around Pump.Fun allegedly using X’s API without proper authorization. Reports claim the platform scraped data without subscribing to X’s paid developer access. This would breach X’s API terms and may have triggered the suspensions.
Some unconfirmed reports also suggest that other accounts under the same umbrella may have hosted inappropriate livestreams. Though not verified, these claims have increased public scrutiny of the affected platforms.
Pump.Fun has already faced criticism for enabling scam tokens. Users on X have claimed that “99% of tokens launched on Pump.Fun are rug pulls.” In March 2025, the platform geo-blocked Indian users without notice, likely due to local crypto regulations.
The bans raise concerns about the future of Solana-based memecoins and decentralized launchpads. Pump.Fun helped fuel this year’s memecoin wave, but its sudden removal from X may shift users toward more regulated platforms. Trust in Solana’s meme token infrastructure appears to be weakening.
Solana Forms Bullish Triangle, Eyes 82% Rally Toward $272
Solana (SOL) has created a bullish triangle pattern on the daily chart. The chart shows the token trading at $149.66, consolidating within a narrowing range formed by a horizontal support line and a descending resistance line.
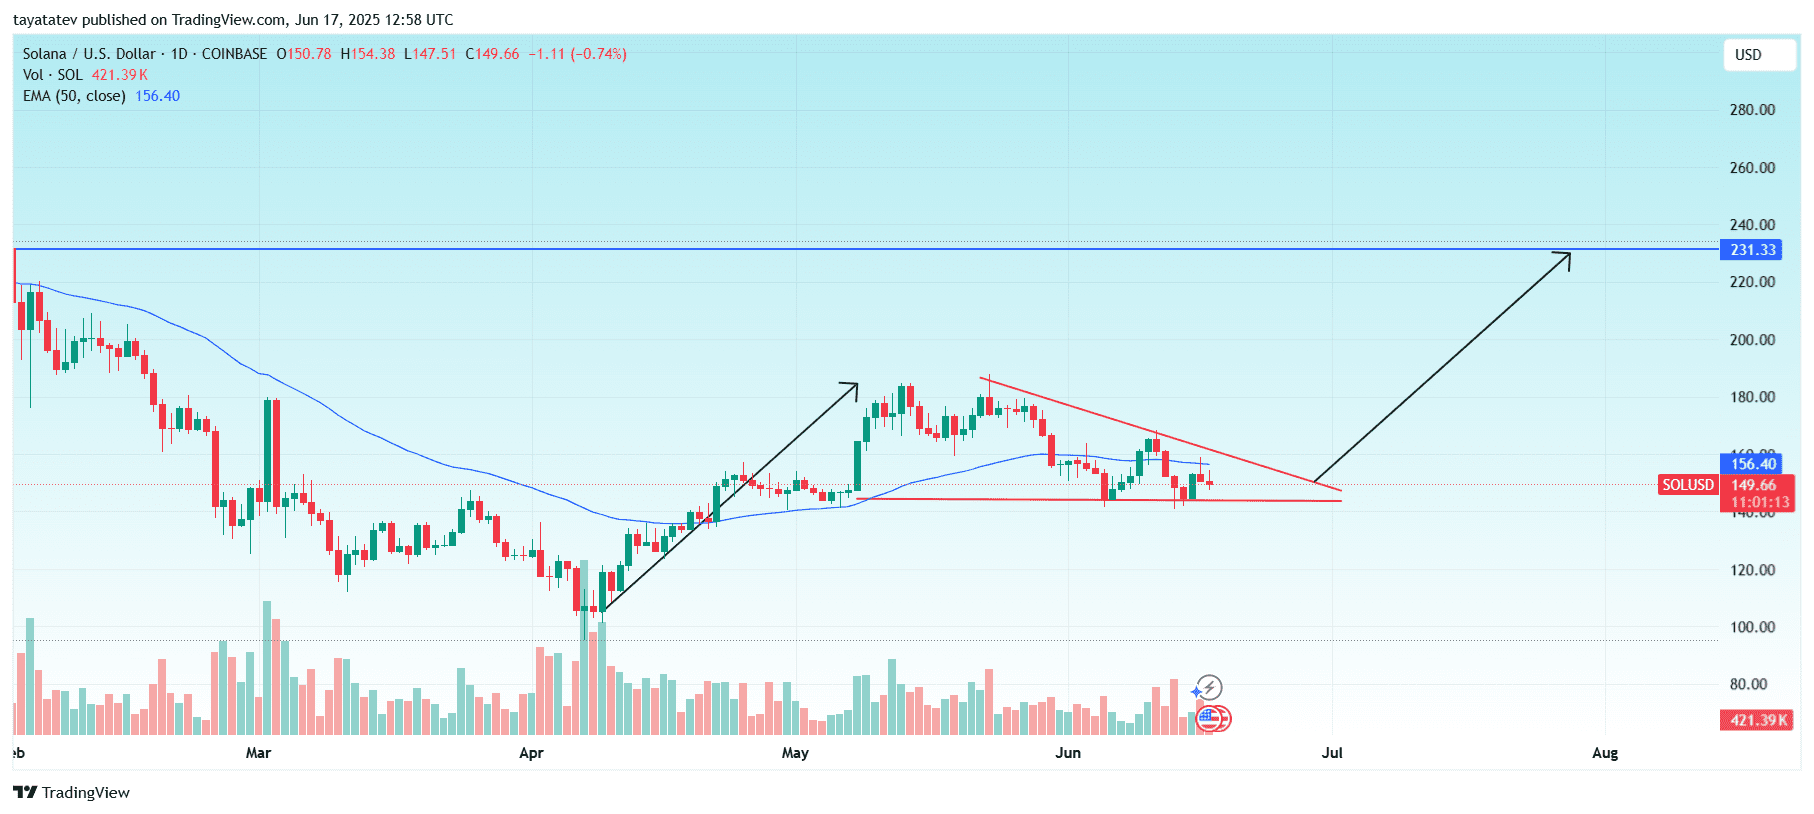
A bullish triangle—also called a bullish symmetrical triangle—forms when price action creates lower highs while maintaining a stable support level. This structure shows that sellers are losing momentum, while buyers continue to defend a key price level. As the triangle tightens, pressure builds. A breakout above the upper trendline often triggers strong upward movement.
If Solana confirms a breakout above the triangle’s resistance, the pattern suggests a potential rally of up to 82% from the current price. Based on this projection, SOL could rise from $149.66 to nearly $272.
Volume during the pattern has decreased, which fits typical triangle formation behavior. A breakout accompanied by a spike in volume would likely confirm the move.
As of June 17, SOL trades below the 50-day EMA at $156.40. A clear move above both the EMA and the triangle resistance would signal strength and could trigger the bullish target zone.
MACD Signals Weak Momentum for Solana
As of June 17, 2025, the MACD indicator for Solana (SOL) shows weak momentum with no confirmed bullish reversal. The MACD line stands at –3.26, while the signal line is slightly higher at –2.69. Both remain below the zero line, confirming that downward momentum is still active.
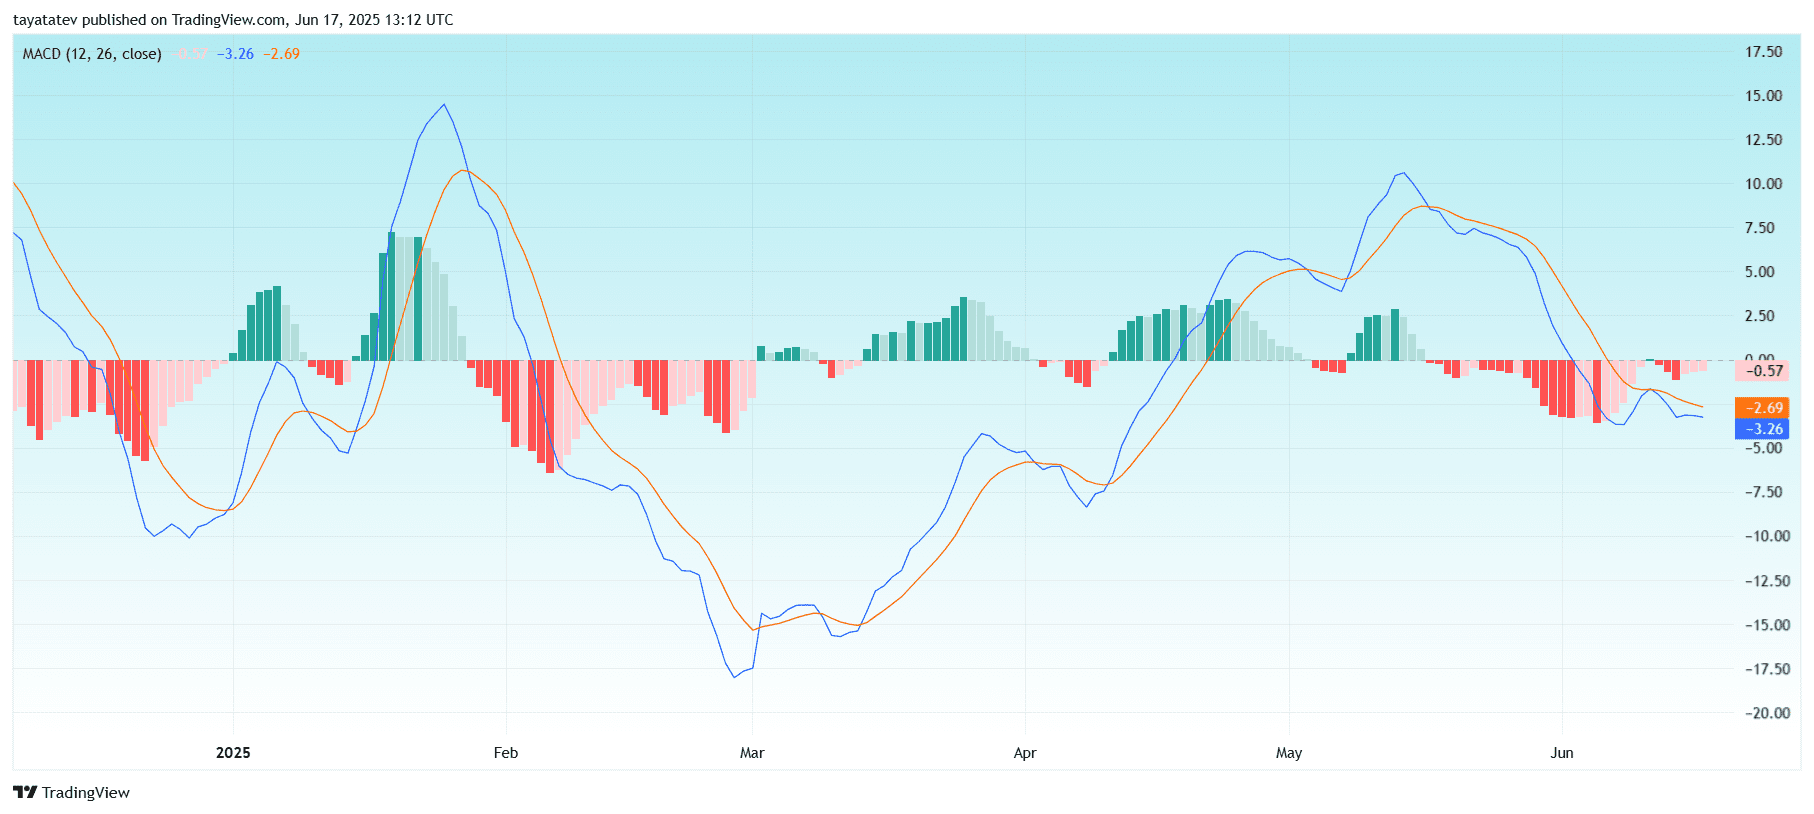
Although the histogram has started to shrink, with the latest bar at –0.57, this only indicates a slight reduction in selling pressure. A bullish crossover has not occurred, meaning the MACD line has not yet crossed above the signal line. Until that happens, the chart does not confirm any upward trend. The setup still leans bearish, and a clear crossover above the signal line is required to support the case for a breakout.
Solana RSI Hovers Below 50 With Weak Momentum
The Relative Strength Index (RSI) for Solana (SOL) currently reads 43.78, with its 14-day simple moving average at 43.36. The RSI is a momentum indicator that measures the speed and magnitude of recent price movements to assess whether a cryptocurrency is overbought or oversold. The standard RSI scale ranges from 0 to 100. Levels above 70 typically signal overbought conditions, while levels below 30 indicate oversold conditions.
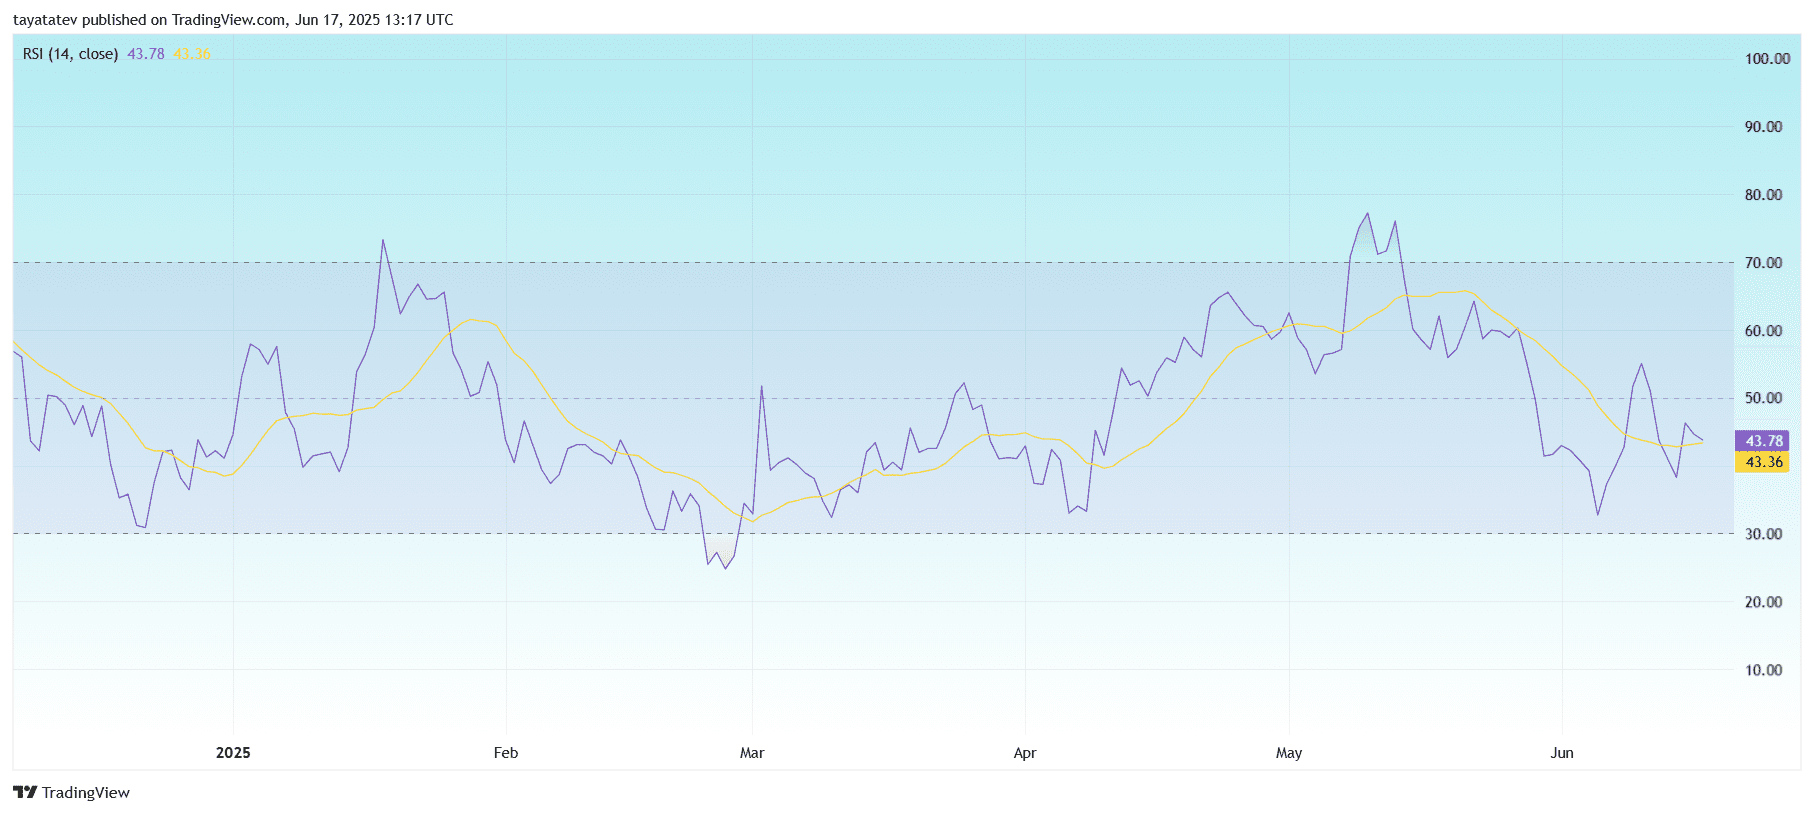
As of now, Solana’s RSI sits below the neutral midpoint of 50. This suggests that the asset is in a bearish or weakening momentum phase. When the RSI stays in the 30 to 50 range, it usually reflects consolidation or downward pressure in price action. Since the RSI and its moving average are moving sideways and remain close to each other, this confirms the lack of strong directional momentum.
There is also no visible bullish or bearish divergence between the RSI and the price chart. Divergences often provide early signals of a trend reversal, but in this case, both indicators continue to align with weak price movement.
If RSI drops toward 30, the token may enter the oversold zone. That level has historically attracted some buying interest, but current readings show that Solana is still hovering in a neutral-to-bearish area with no clear signal of a reversal yet.
Directional Movement Index Shows Mixed Trend Signals for Solana
The Directional Movement Index (DMI) for Solana (SOL) uses three lines to evaluate trend strength and direction: the Positive Directional Indicator (+DI), the Negative Directional Indicator (–DI), and the Average Directional Index (ADX). These are plotted here with the following values:
-
+DI (orange line): 24.39
-
–DI (blue line): 21.34
-
ADX (red line): 16.74
The +DI is currently above the –DI, which normally indicates bullish pressure. However, the ADX remains below 20, suggesting that the ongoing trend is weak or not well-established. The ADX measures trend strength regardless of direction. Readings below 20 often indicate a lack of trend or choppy market behavior.
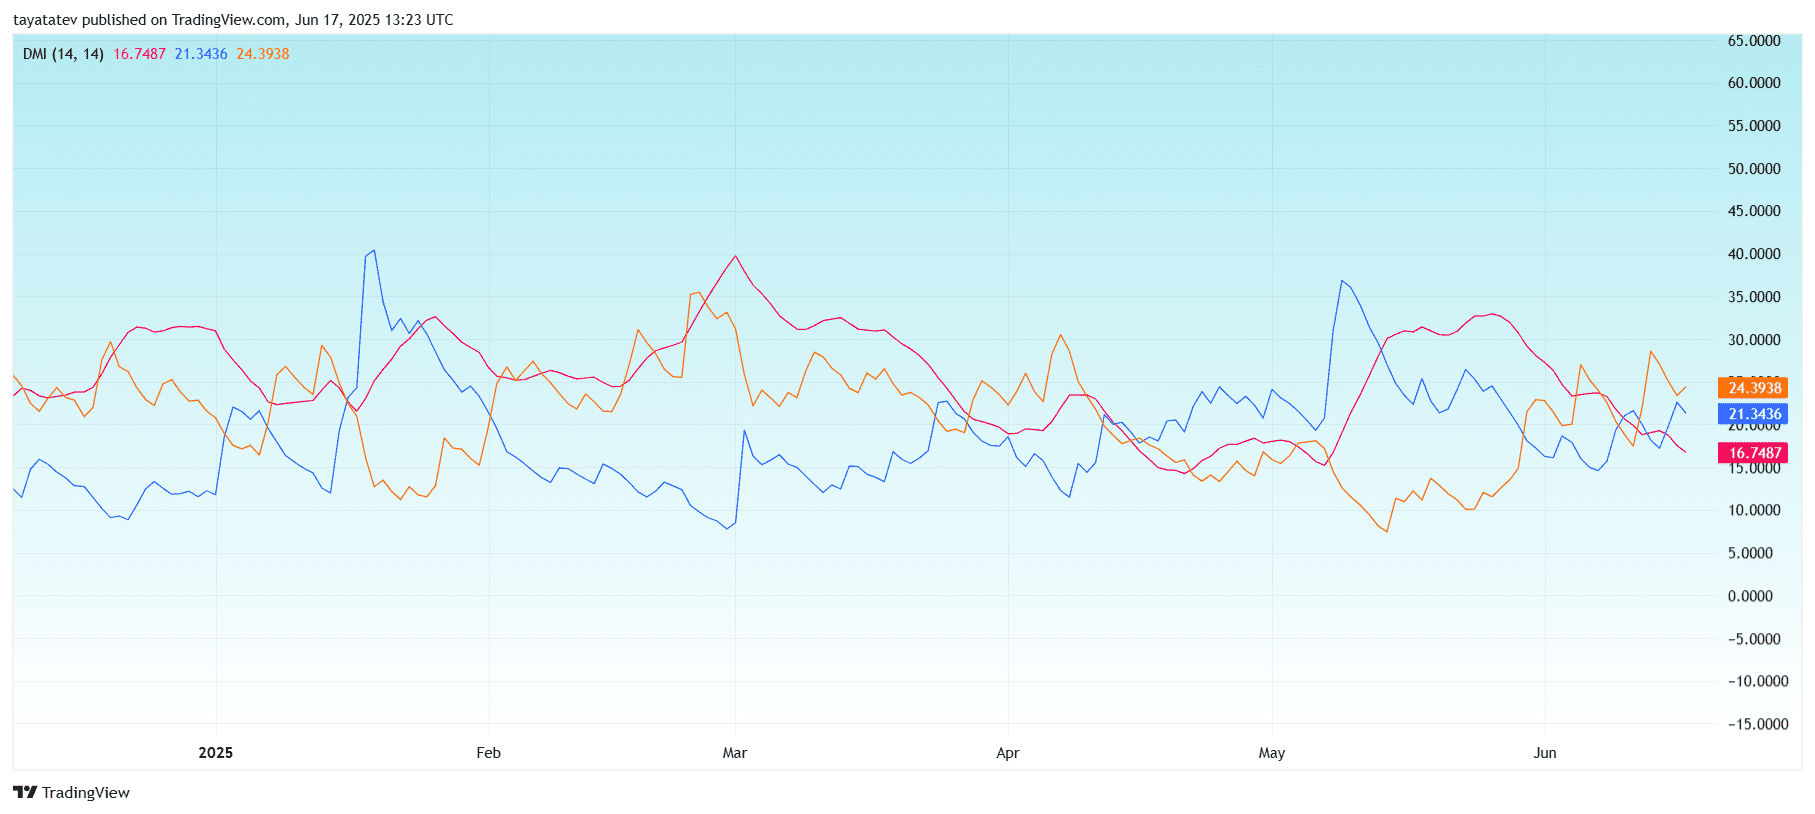
Over recent weeks, the +DI and –DI have crossed multiple times, showing indecision and back-and-forth movement between buyers and sellers. At present, buyers hold a slight edge, but without strong ADX support, any directional move lacks confirmation.
For the signal to turn stronger, ADX would need to rise above 20–25, ideally while +DI stays above –DI. Until then, Solana’s price action may continue sideways or experience short-term fluctuations without sustained movement


