

On May 30, 2025, the SUI to Tether (SUI/USDT) trading pair on the 4-hour Binance chart created a descending channel pattern.
A descending channel appears when a cryptocurrency’s price moves between two parallel trendlines that slope downward. This pattern often shows a temporary downtrend within a broader bullish setup and typically signals a possible reversal if the price breaks above the upper boundary.
The chart shows that SUI’s price has been moving lower since early May. It bounced between the upper and lower red trendlines, forming lower highs and lower lows. During this period, the price also dropped below the 50-period Exponential Moving Average, which currently stands at $3.6285. That shift below the average indicated weakening short-term momentum.
Despite the decline, volume spikes during selected sessions show that buyers have remained active at lower levels. If SUI breaks out above the upper red trendline of the descending channel, the price could rally sharply. Based on the height of the pattern’s initial upward leg, SUI may climb 46% from the current level of $3.44 to a projected target near $5.02.
This possible move would push SUI back above recent resistance zones and restore bullish momentum.
SUI RSI Drops Below Neutral Zone, Signaling Weak Momentum
On May 30, 2025, the Relative Strength Index (RSI) for SUI/USDT on the 4-hour chart fell to 39.27, according to TradingView.
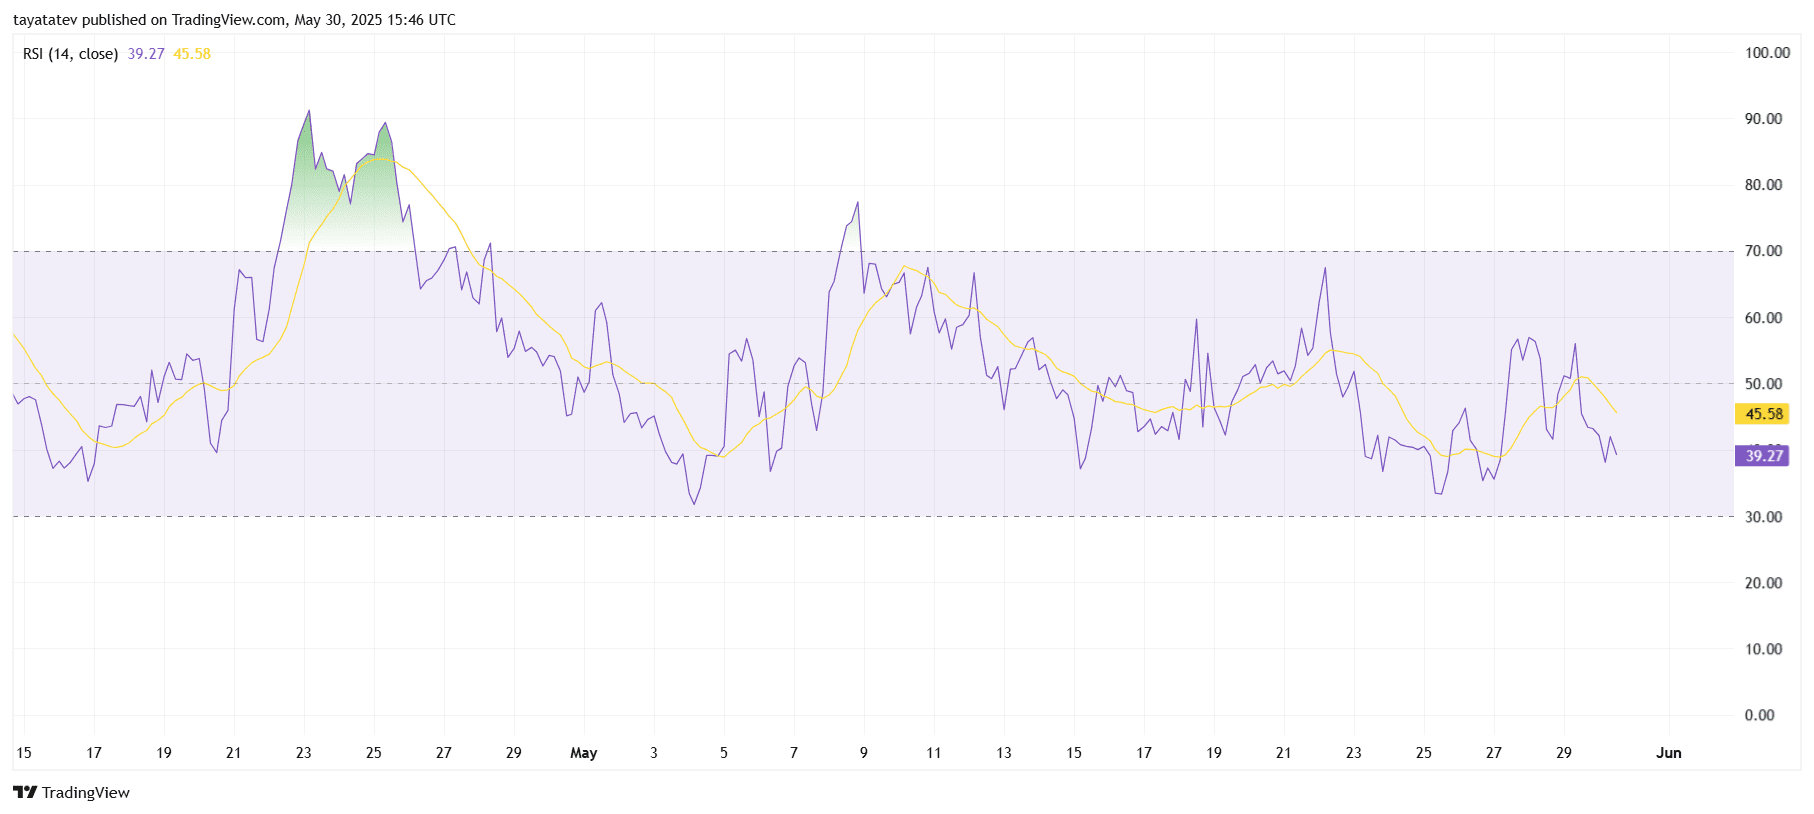
The RSI (Relative Strength Index) is a momentum indicator that measures the speed and change of price movements on a scale from 0 to 100. Values above 70 usually indicate overbought conditions, while values below 30 suggest oversold levels.
Currently, SUI’s RSI has moved below the midpoint of 50 and remains far from the overbought zone. It also trades below its 14-period moving average, which stands at 45.58. This gap confirms weak buying momentum and increased bearish pressure.
The RSI curve has been fluctuating under 50 since late May, reflecting a lack of strong upward momentum. If RSI continues to stay below its moving average and does not recover toward the neutral 50 zone, the price may struggle to gain strength without a breakout from the descending channel.
SUI MACD Turns Bearish as Momentum Weakens
The Moving Average Convergence Divergence (MACD) indicator for SUI/USDT flashed a bearish signal on the daily chart, according to TradingView.
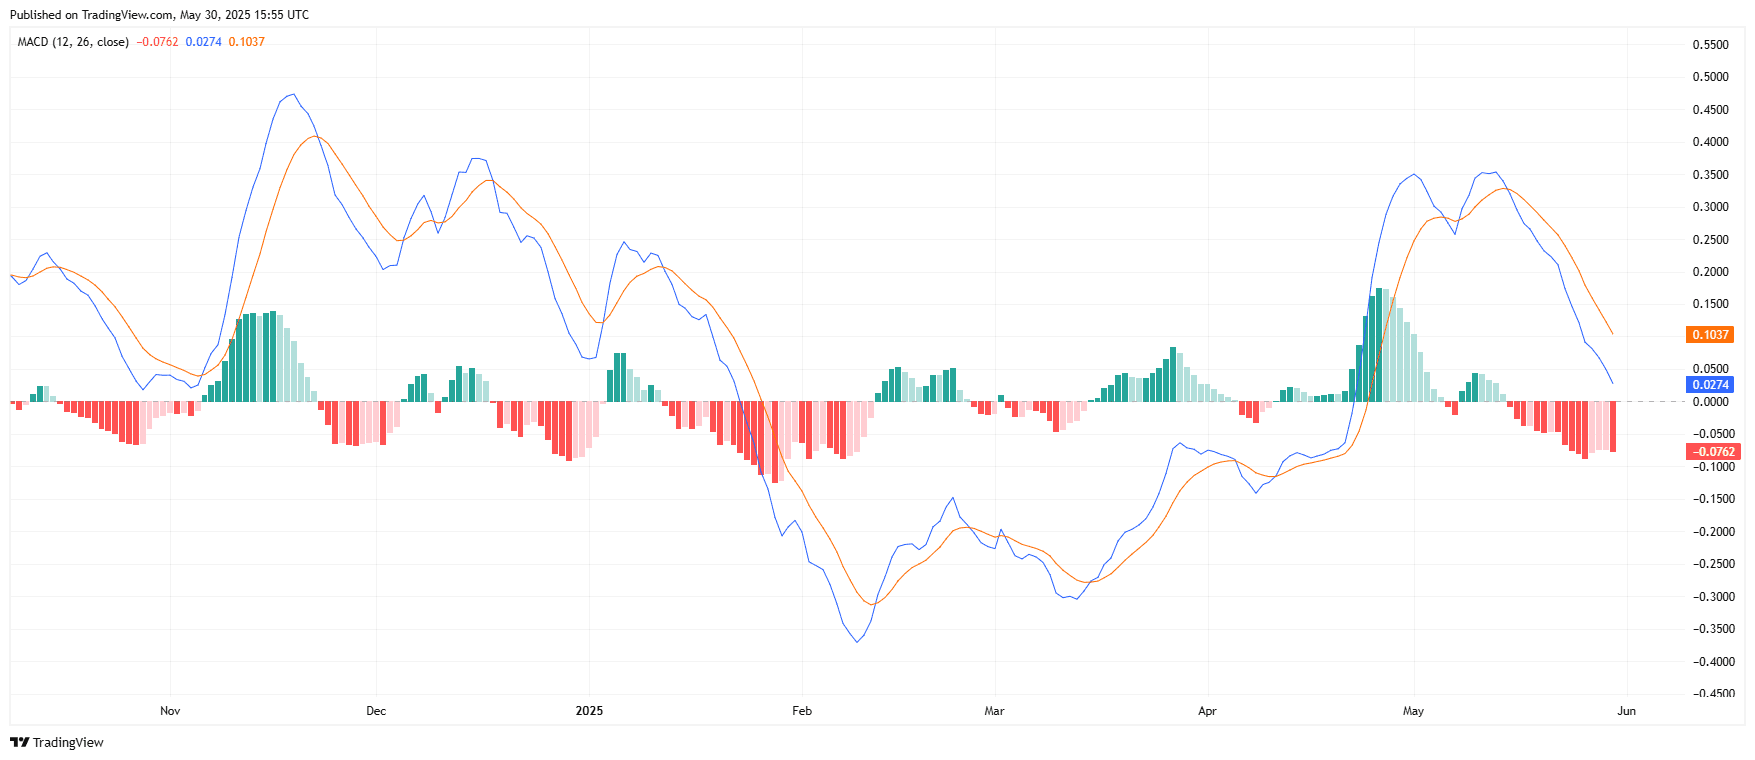
The MACD (Moving Average Convergence Divergence) measures the relationship between two exponential moving averages—usually the 12-period and 26-period—and helps identify trend direction and momentum strength. When the MACD line crosses below the signal line, it often suggests a potential downtrend.
As of now, the MACD line sits at –0.0762, while the signal line stands higher at 0.1037. This crossover below the signal line confirms bearish divergence. At the same time, the histogram shows expanding red bars, reflecting growing negative momentum.
The blue MACD line has been trending downward since mid-May, following SUI’s failed recovery attempts. The current setup indicates continued selling pressure unless the MACD line turns back above the signal line.
SUI Directional Indicator Confirms Weak Trend Strength
On May 30, 2025, the Directional Movement Index (DMI) for SUI/USDT on the daily chart signaled weakening trend strength, according to TradingView.
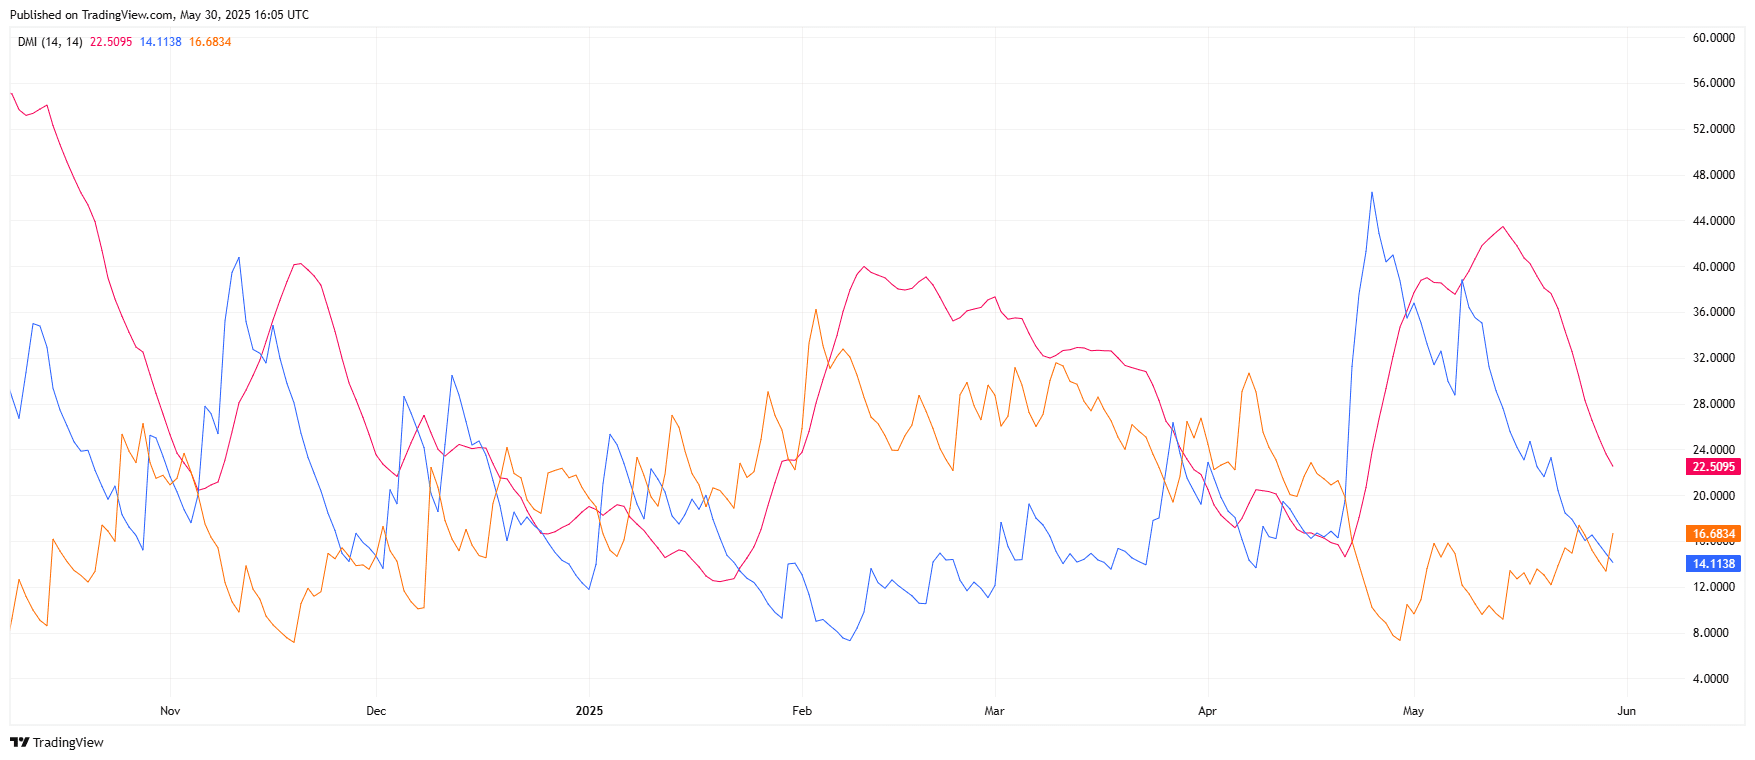
The DMI indicator includes three components:
– +DI (Positive Directional Indicator), which measures upward pressure
– –DI (Negative Directional Indicator), which measures downward pressure
– ADX (Average Directional Index), which shows the overall strength of the trend
At the time of the chart, the +DI stands at 14.11, the –DI is higher at 22.50, and the ADX reads 16.68. When the –DI stays above the +DI, it confirms that sellers are in control. Meanwhile, an ADX below 20 suggests that the current trend—bullish or bearish—lacks strong momentum.
The setup shows that bearish pressure outweighs bullish demand. However, the low ADX value means the trend remains weak overall, with no major directional conviction. This explains the sideways movement in SUI’s price, despite forming a descending channel.
Sui Approves $162M Repayment Plan After Cetus Exploit
On May 29, 2025, Sui validators approved a governance proposal to release $162 million in frozen funds linked to the recent Cetus exploit. The vote passed with 90.9% in favor, 1.5% abstaining, and 7.2% not participating, according to Sui’s official governance portal.
The decision followed a major security breach on May 22, when the decentralized exchange Cetus lost over $220 million in digital assets. Shortly after the attack, validators froze $162 million of the compromised funds.
With the proposal now approved, the frozen assets will be transferred to a multisignature wallet. Sui stated in a post on X that the funds will be held in trust until returned to users based on Cetus’s official recovery plan.

This move has triggered renewed debate about decentralization. Some users questioned the validators’ ability to freeze onchain assets, while others called the swift action necessary to protect users from further loss.
The vote forms part of a wider recovery strategy. Alongside the $162 million, Cetus will use funds from its treasury and draw on an emergency loan from the Sui Foundation to support full repayment and relaunch operations.
Cetus shared its post-vote roadmap on May 29. First, Sui validators will execute a chain upgrade to transfer the frozen funds. Once that’s complete, Cetus will deploy a recovery pool upgrade and begin restoring user data.
The protocol aims to complete the full recovery and resume operations within one week. It also confirmed that a new compensation contract is under development. The contract will be reviewed by external auditors before launch.
After the restart, Cetus plans to return liquidity to all affected providers. Users with unrecovered funds will be able to claim the remaining balances through the compensation contract once it goes live.


